Millions of tons of plastic are produced worldwide every year. Only half of this plastic garbage is recycled, incinerated, or dumped into landfills. A substantial portion of leftover plastic finally ends up in oceans.
Many fragments of ocean plastic waste have come together to form a patch of plastic waste thrice the size of France in the Pacific Ocean between Hawaii and California.
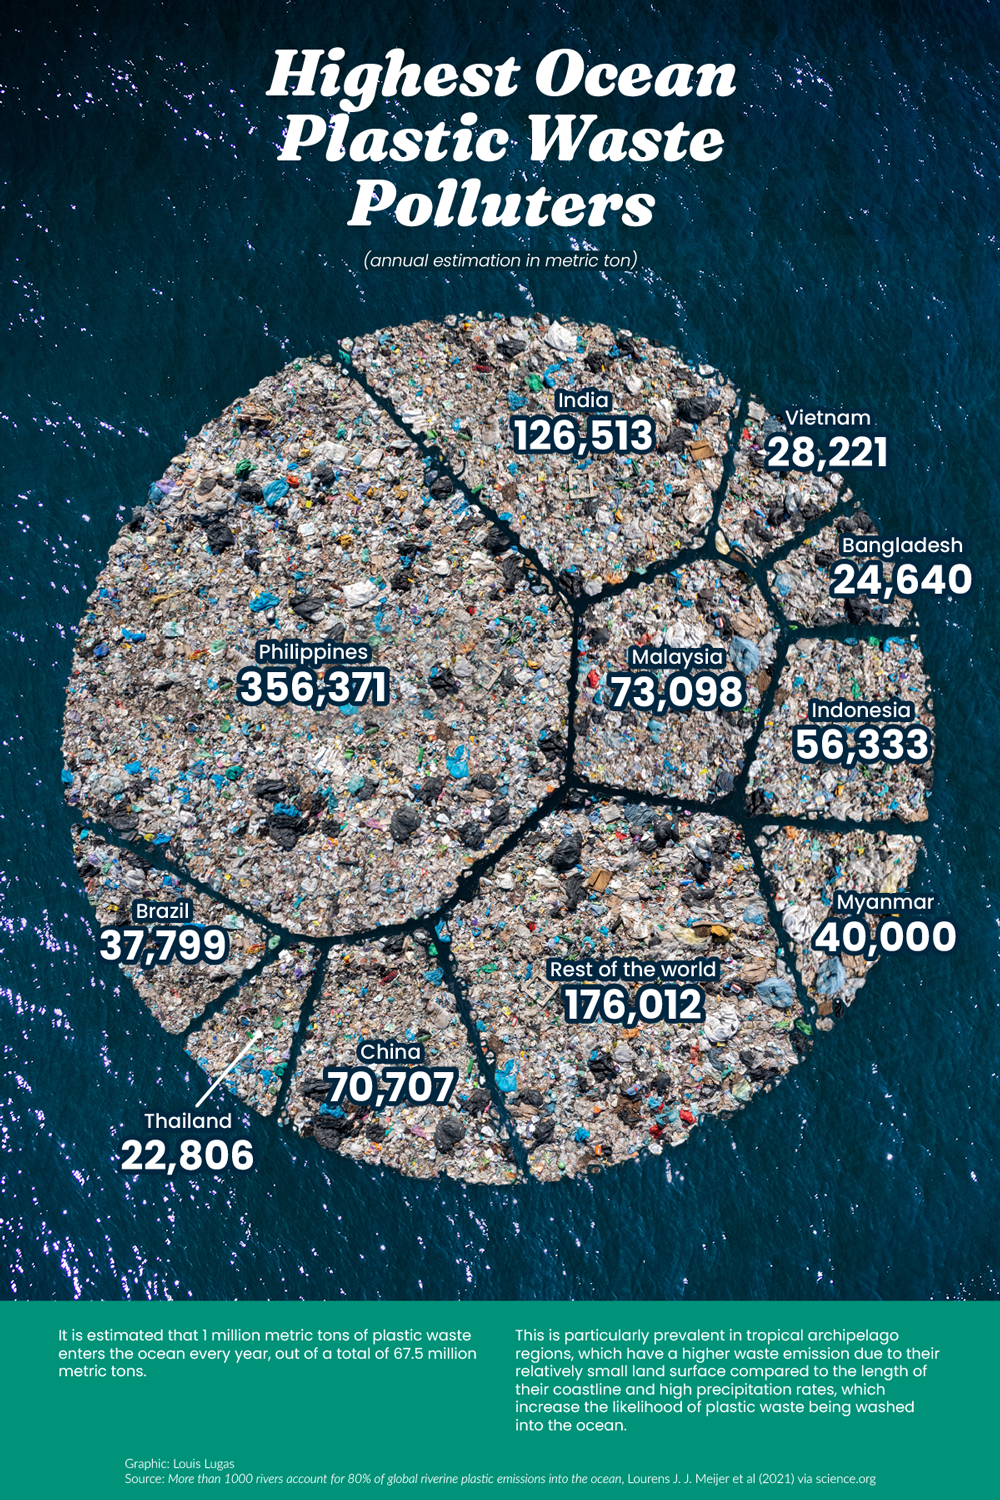
Where does all of this plastic garbage come from? Louis Lugas Wicaksono utilized data from a research paper by Lourens J.J. Meijer and his team to emphasize the top 10 nations emitting plastic pollutants in the waters encircling them.
Most plastic garbage in deep blue waters arrives from the trash in parks, beaches, or along the storm drains lining the streets of the cities. Wind and rainwater drainage carry this plastic debris into our gutters, streams, and rivers.
The rivers then turn into plastic superhighways, carrying the plastic to the oceans.
An extra portion of ocean plastic comes from destroyed fishing or ghost nets directly dumped on the high seas.
Which nations pollute the most ocean plastic waste?
Many think that the nations making or consuming the most plastic are the ones that pollute the oceans the most. But that’s not correct.
According to the analysis, nations with a less geographical area, longer shores, high rainfall, and poor waste control systems are more likely to wash plastics into the ocean.
For instance, China produces ten times the plastic garbage that Malaysia does. However, 9 percent of Malaysia’s total plastic debris is assessed to reach the ocean, compared to China’s 0.6 percent.
Top 10 plastic polluters by annual ocean plastic waste in metric tons
#1 Philippines - 356,371
#2 India - 126,513
#3 Malaysia - 73,098
#4 China - 70,707
#5 Indonesia - 56,333
#6 Myanmar - 40,000
#7 Brazil - 37,799
#8 Vietnam - 28,221
#9 Bangladesh - 24,640
#10 Thailand - 22,806
Rest of the World - 176,012
Total - 1,012,500
The Philippines - an archipelago of over 7 thousand islands with a 36,289-kilometer shoreline and 4,820 plastic-emitting rivers - is calculated to emit 35 percent of the ocean’s plastic.
Besides the Philippines, over 75 percent of the accumulated plastic in the ocean is declared to come from mismanaged waste in Asian nations, including India, Malaysia, China, Indonesia, Myanmar, Vietnam, Bangladesh, and Thailand.
Brazil is the only non-Asian nation to reach this top ten list, with 1,240 rivers, including the Amazon.

This post may contain affiliate links. As an Amazon Associate, I earn from qualifying purchases.
Comments
Post a Comment