According to the World Health Organisation, in 2022, 99% of the world’s population is breathing polluted air. It’s not a new issue, either: air pollution and its health effects have been on humanity’s radar for thousands of years. But while the phrase ‘air pollution’ might conjure up images of thick smog and eye-watering smoke, the most harmful type of air pollution particles are invisible to the naked eye.
Particulate matter 2.5 (PM2.5) describes pollutant particles so small that they can pass into your bloodstream and cause various health problems. In fact, they’re responsible for the deaths of around 4.2 million people worldwide each year. As it won’t disappear completely anytime soon, the WHO wants to reduce average annual levels to no more than five micrograms per cubic meter of air (µg/m3).
Much of the world still has a long way to go in reducing harmful air pollution levels, but the good news is that some cities are making great strides toward cleaning up the air.
With this in mind, the researchers at HouseFresh wondered: based on changing local levels of PM2.5, where worldwide has air pollution improved — or worsened — the most in recent years?
Key Findings
● Out of 480 global cities, Dammam in Saudi Arabia has seen air pollution levels increase the most (+111.1µg/m3).
● Ulan Bator, Mongolia, has seen air pollution levels decrease the most (-23.4µg/m3).
● In Europe, Salamanca, Spain, saw air pollution levels rise the most (+5.1µg/m3), while levels in Skopje, North Macedonia, have dropped the most (-12.4µg/m3).
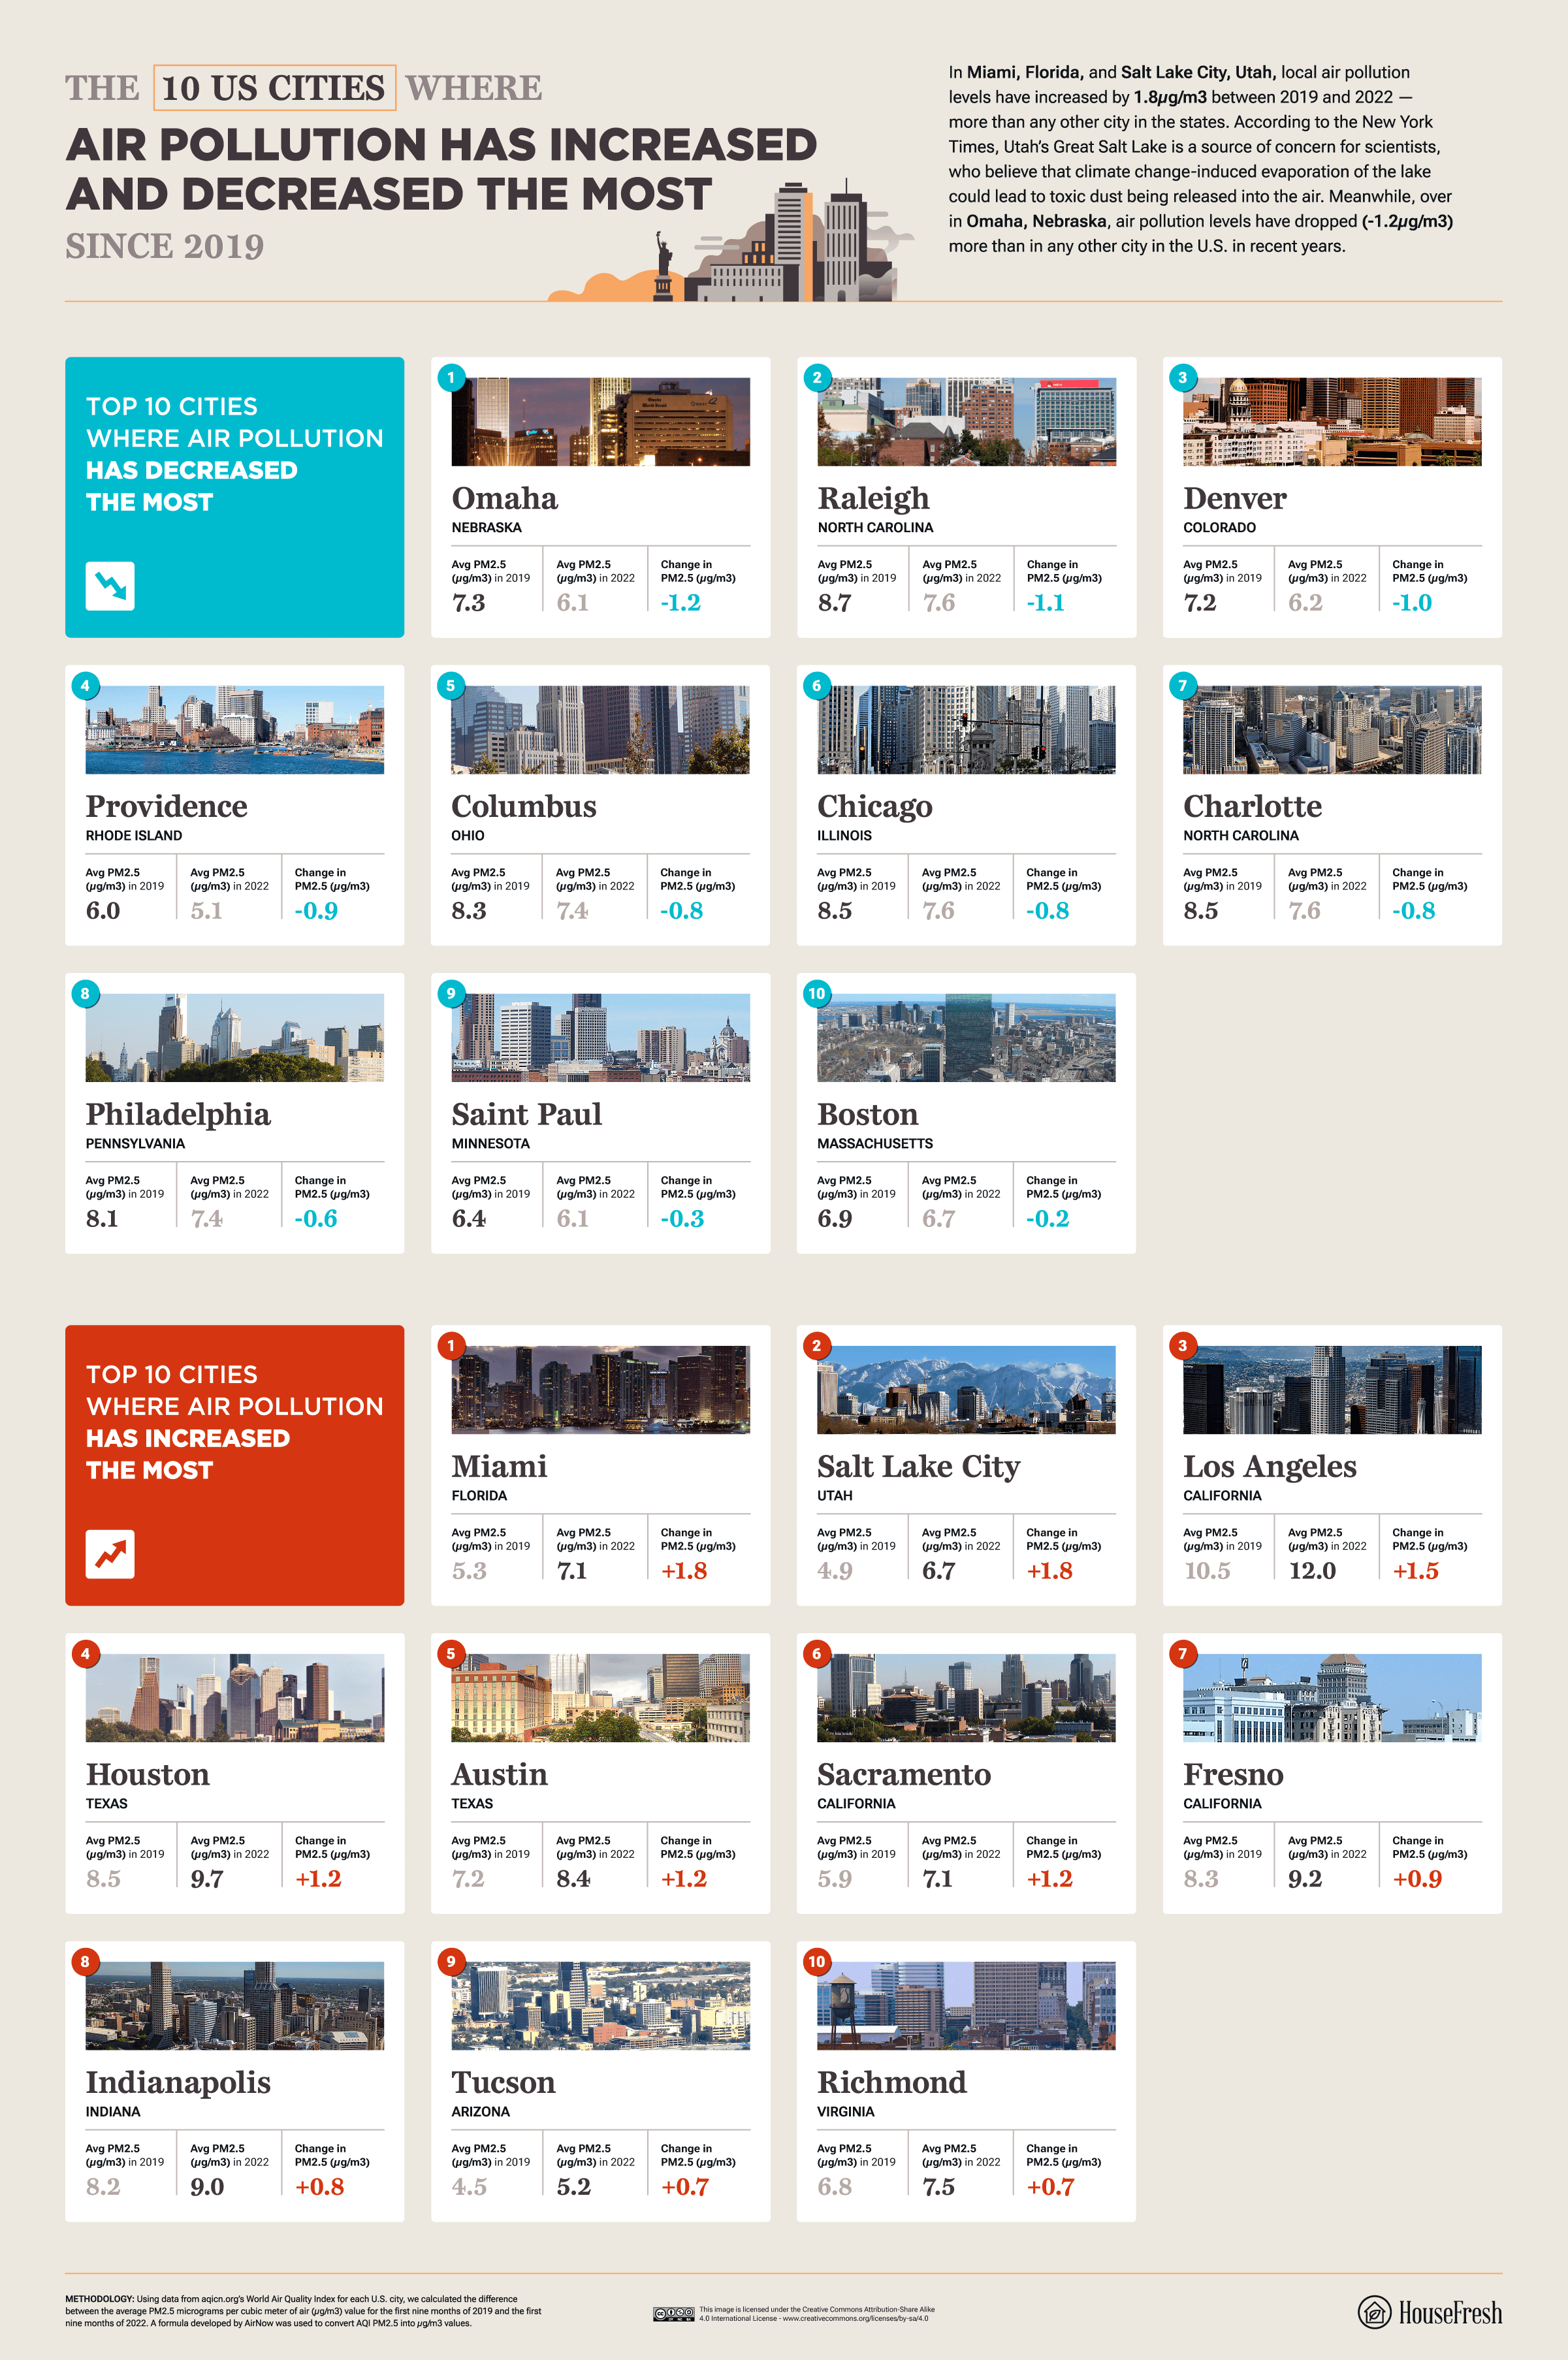
● In the U.S., Miami (FL) and Salt Lake City (UT) saw air pollution increase the most (+1.8µg/m3), and Omaha (NE) saw the most significant decrease (-1.2µg/m3).
The Change in Air Pollution in Capital Cities Since 2019
The map below shows how air pollution levels have changed in 70 capital cities worldwide between 2019 and 2022, indicated by the change in PM2.5 micrograms per cubic meter of air (pg/m3).
The 10 Global Cities Where Air Pollution Has Increased and Decreased the Most
Since 2019, air pollution levels in the city of Dammam, Saudi Arabia, have risen by 111.1pg/m3, the biggest increase seen by any city in the world. According to the Aviation Environment Federation, many harmful emissions are generated at airports, and Dammam is home to the world's largest (King Fahd International Airport). Air pollution levels have dropped the most in Ulan Bator, Mongolia (-23.4pg/m3). Before a government ban in 2019, locals of the coldest capital city on Earth would burn raw coal to keep warm, causing some of the unhealthiest air on the planet.
The U.S. Cities Where Air Pollution Has Increased and Decreased the Most
In Miami, Florida, and Salt Lake City, Utah, local air pollution levels have increased by 1.8pg/m3 between 2019 and 2022 — more than any other city in the states. According to the New York Times, Utah's Great Salt Lake is a source of concern for scientists, who believe that climate change-induced evaporation of the lake could lead to toxic dust being released into the air. Meanwhile, over in Omaha, Nebraska, air pollution levels have dropped (-1.2pg/m3) more than in any other city in the U.S. in recent years.
The European Cities Where Air Pollution Has Increased and Decreased the Most
Between 2019 and 2022, air pollution levels in Salamanca, Spain, have increased (+5.1pg/m3) more than in any other European city. The city is one of 150 in Spain that is required to launch low-emission zones for vehicles from 2023 because of new climate change laws. Skopje, North Macedonia, has seen the most air pollution levels drop (-12.4pg/m3). According to the matchup project, locals have been pressuring policymakers to clean up the city's air quality, which ranks as some of the worst in the world because of the city's location and fossil fuel usage.
Methodology
Using data from aqicn.org’s World Air Quality Index for each city, HouseFresh calculated the difference between the average PM2.5 micrograms per cubic meter of air (µg/m3) value for the first nine months of 2019 and the first nine months of 2022. A formula developed by AirNow was used to convert AQI PM2.5 into µg/m3 values. The original data for New York City is split into its constituent boroughs, so the team used the average value of pollution levels across all boroughs. Cities in Ukraine were excluded from the comparison due to the ongoing military conflict inevitably impacting on the level of air pollution.
The data was collected in October 2022.


This post may contain affiliate links. As an Amazon Associate, I earn from qualifying purchases.
Comments
Post a Comment