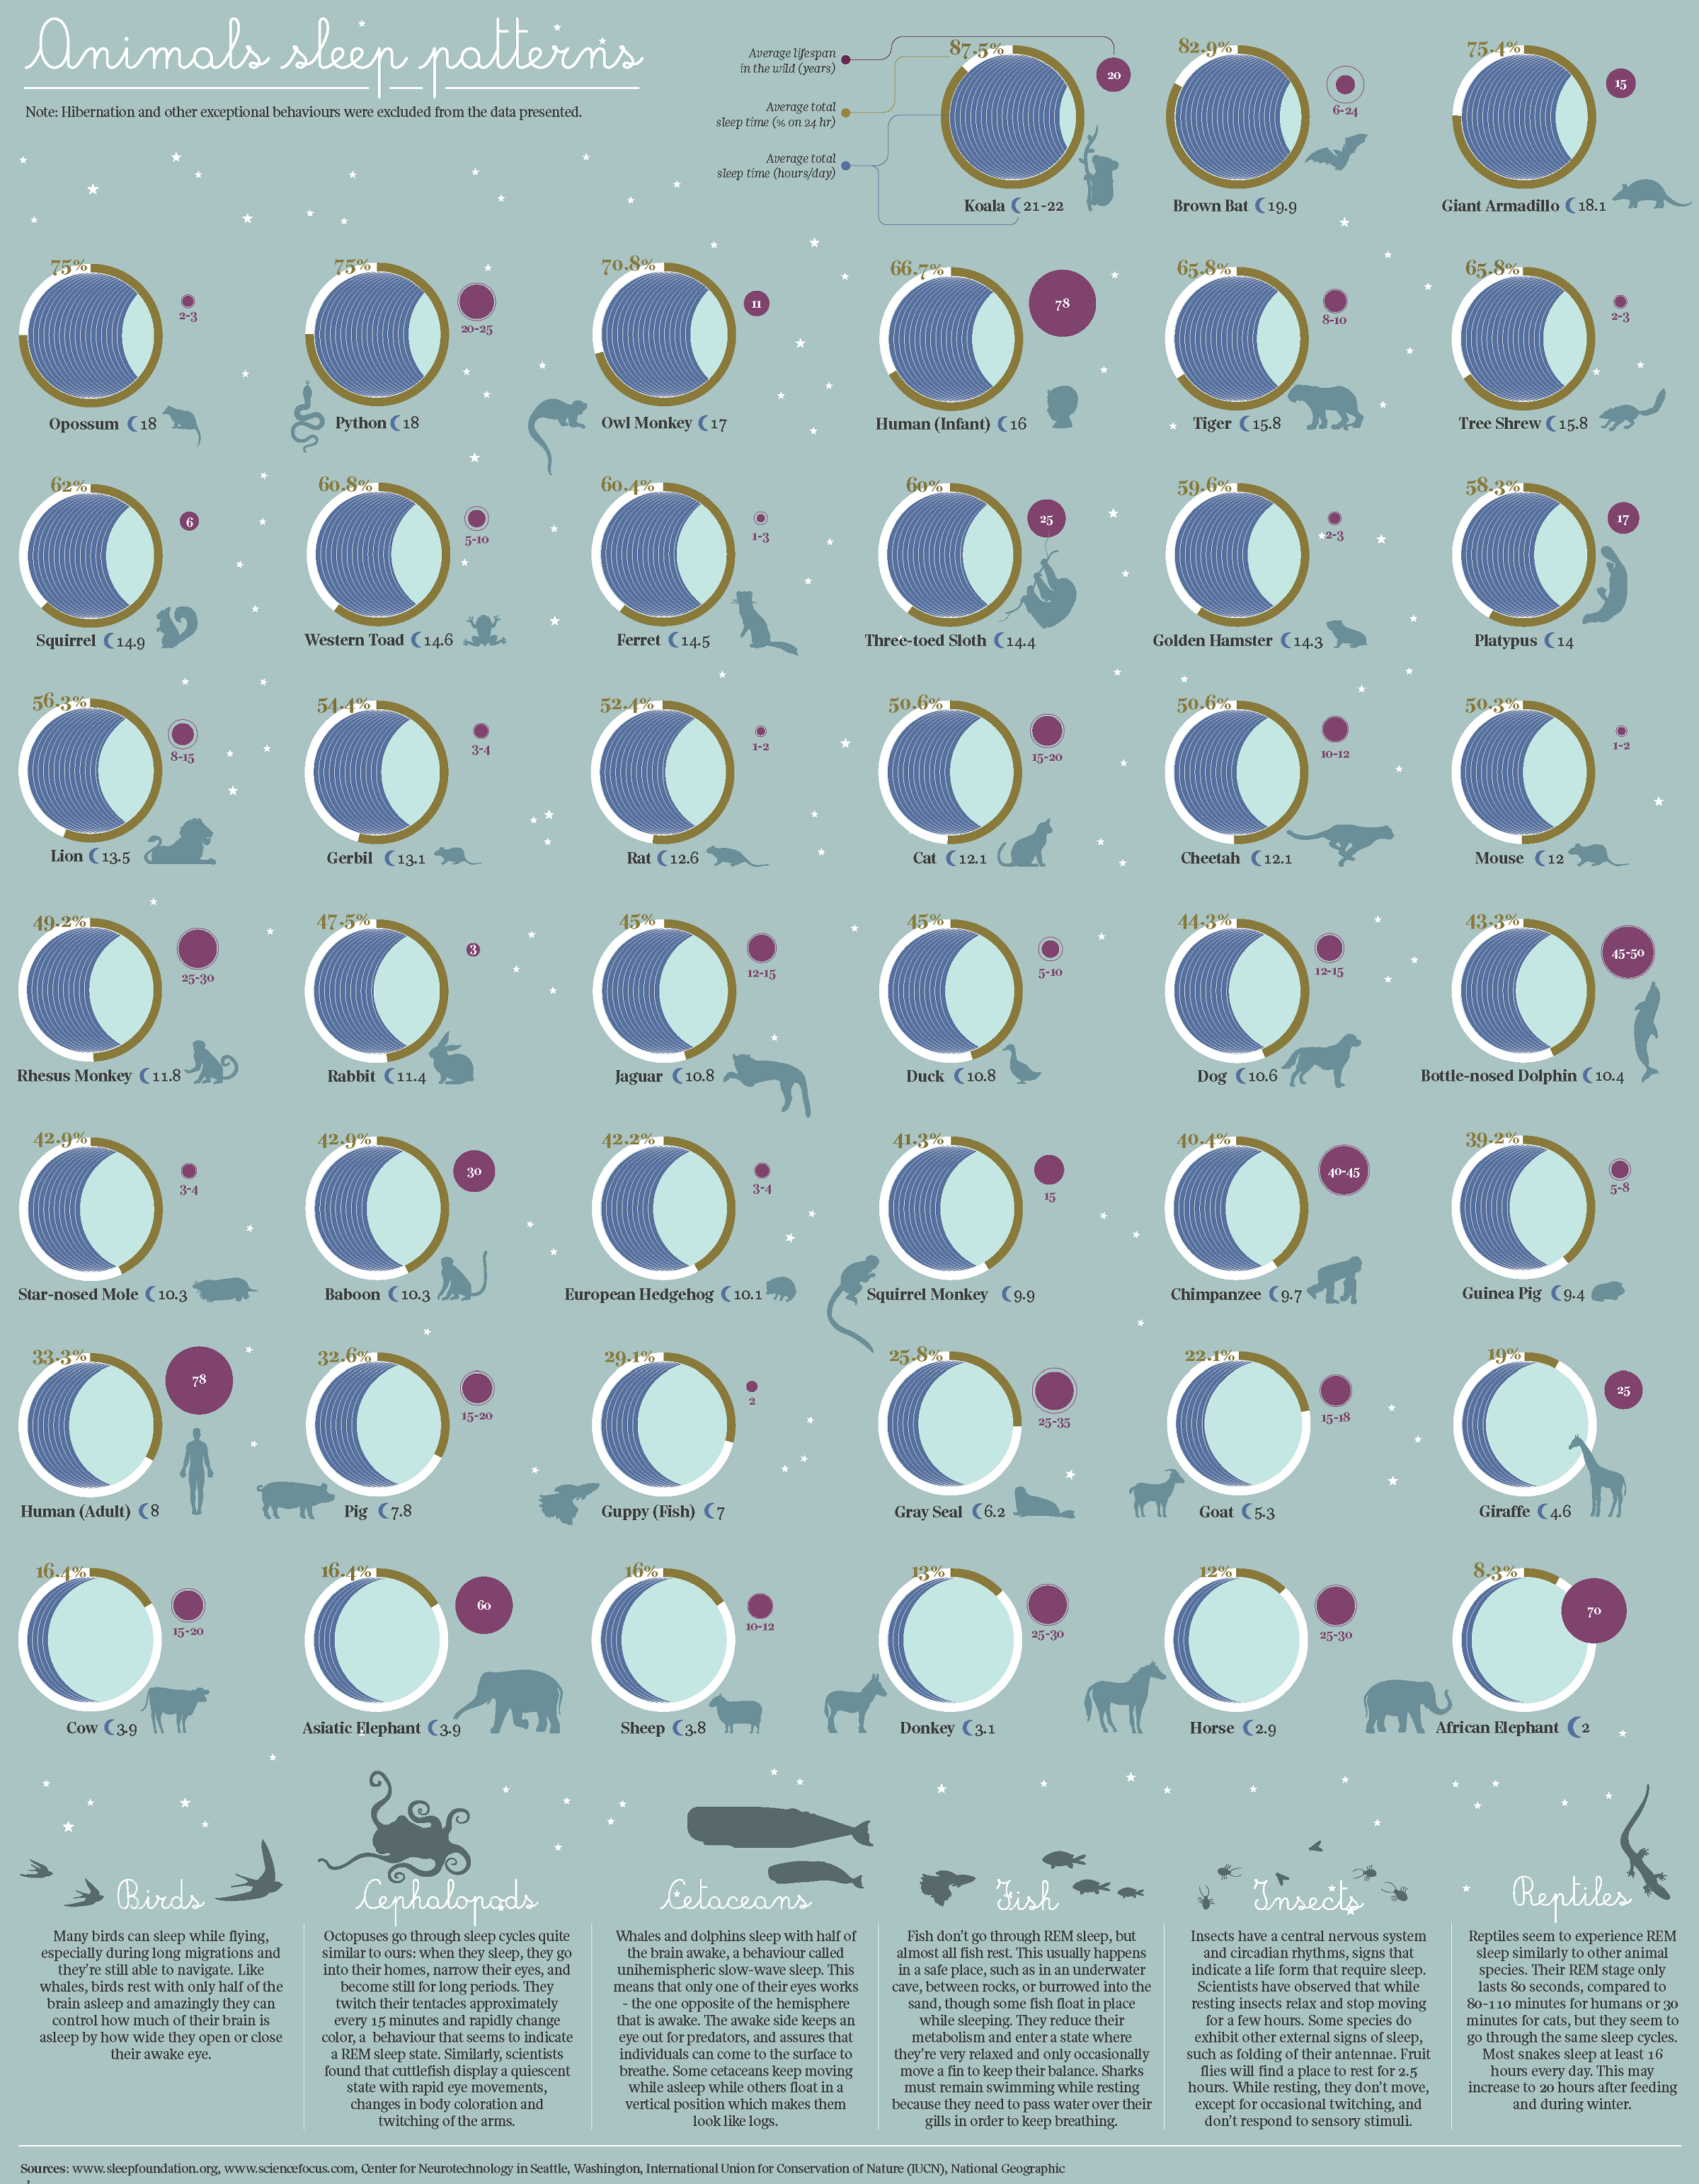
Mammals sleep to preserve their energy and recover physical and mental energy. The amount of sleep a mammal needs hinges on many factors, including environment, body size, diet, age, and the safety of its sleep place. Whether animals settle on land or sea can also influence how much sleep it requires.
Different mammals spend various amounts of time in non-REM sleep and REM sleep. However, all mammals examined exhibit signs of REM sleep, suggesting that mammals dream as humans do.
Talking about mammalian sleep is often classified as monophasic or polyphasic. Monophasic sleep represents animals who get their sleep in one concentrated period. For instance, humans are monophasic sleepers. Our circadian rhythms stimulate us to sleep for prolonged periods at night and be active and alert during the daytime.
Polyphasic sleepers have a rest for multiple periods throughout a 24-hour cycle. Polyphasic sleep is familiar, as many animals must keep caution against predators. However, if dangers are minimized, animals can have a monophasic sleep.
Within animals, the amount of sleep demanded differs from species.
This graphic by Giulia De Amicis analyzed data from startsleeping.com to show the typical sleeping patterns of 40 animals, emphasizing their average sleep times and the percentage of each 24-hour day they sleep.
Compared to the rest of the animals presented in the graphic, we require a relatively small amount of sleep. Humans rest an average of 8 hours or 33% of our day.
For comparison, Koalas sleep up to 22 hours daily, or 87.5% of the day. This is primarily because of the Koala’s diet - Eucalyptus leaves, which are toxic and need a lot of energy to digest.
|
Animal |
Average Sleep Time (hrs/day) |
Average Sleep Time (% of 24 hours) |
|
Koala |
21-22 |
87.5% |
|
Brown Bat |
19.9 |
82.9% |
|
Giant Armadillo |
18.1 |
75.4% |
|
Opossum |
18.0 |
75.0% |
|
Python |
18.0 |
75.0% |
|
Owl Monkey |
17.0 |
70.8% |
|
Human (Infant) |
16.0 |
66.7% |
|
Tiger |
15.8 |
65.8% |
|
Tree Shrew |
15.8 |
65.8% |
|
Squirrel |
14.9 |
62.0% |
|
Western Toad |
14.6 |
60.8% |
|
Ferret |
14.5 |
60.4% |
|
Three-toed Sloth |
14.4 |
60.0% |
|
Golden Hamster |
14.3 |
59.6% |
|
Platypus |
14.0 |
58.3% |
|
Lion |
13.5 |
56.3% |
|
Gerbil |
13.1 |
54.4% |
|
Rat |
12.6 |
52.4% |
|
Cat |
12.1 |
50.6% |
|
Cheetah |
12.1 |
50.6% |
|
Mouse |
12.0 |
50.3% |
|
Rhesus Monkey |
11.8 |
49.2% |
|
Rabbit |
11.4 |
47.5% |
|
Jaguar |
10.8 |
45.0% |
|
Duck |
10.8 |
45.0% |
|
Dog |
10.6 |
44.3% |
|
Bottle-nose Dolphin |
10.4 |
43.3% |
|
Star-nosed Mole |
10.3 |
42.9% |
|
Baboon |
10.3 |
42.9% |
|
European Hedgehog |
10.1 |
42.2% |
|
Squirrel Monkey |
9.9 |
41.3% |
|
Chimpanzee |
9.7 |
40.4% |
|
Guinea Pig |
9.4 |
39.2% |
|
Human (Adult) |
8.0 |
33.3% |
|
Pig |
7.8 |
32.6% |
|
Guppy (Fish) |
7.0 |
29.1% |
|
Gray Seal |
6.2 |
25.8% |
|
Goat |
5.3 |
22.1% |
|
Giraffe |
4.6 |
19.0% |
|
Cow |
3.9 |
16.4% |
|
Asiatic Elephant |
3.9 |
16.4% |
|
Sheep |
3.8 |
16.0% |
|
Donkey |
3.1 |
13.0% |
|
Horse |
2.9 |
12.0% |
|
African Elephant |
2.0 |
8.3% |

This post may contain affiliate links. As an Amazon Associate, I earn from qualifying purchases.
Comments
Post a Comment