By 2020, it is projected that about 6 billion people will live in coastal areas (60 percent of the world’s population).
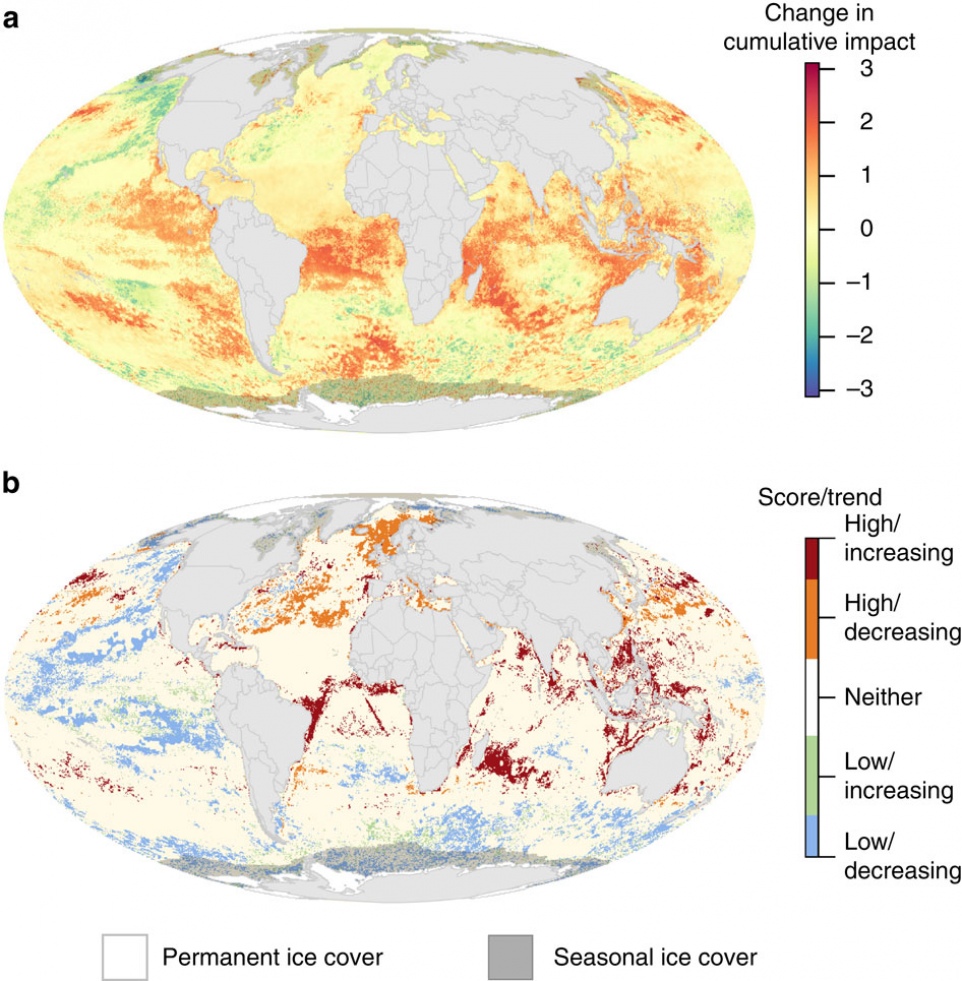
Cumulative Impact Scores (CIS)
CIS are based on all 19 anthropogenic stressors. Areas of permanent sea ice are shaded white and the area within maximum sea ice extent is masked to indicate where scores are less certain because change in sea ice extent could not be included.
")
Difference between current & earlier cumulative impact scores (2008 - 2013)

Facts:
- Almost 66% of the ocean showed increases of cumulative impact, mostly in tropical, subtropical and coastal regions. The French Territorial holdings in the Indian Ocean, Tanzania and Seychelles showed the most dramatic average increases.
- National waters currently experiencing highest levels of impacts are Singapore, Jordan, Slovenia and Bosnia. Most impacted coastal eco-regions include the Faroe Islands, Eastern Caribbean, Cape Verde and Azore Islands.
- 13% of the ocean experienced decreased impacts, mostly in the Northeast and Central Pacific and Eastern Atlantic. EEZ’s of several South Pacific Islands, the Alaskan coast, and several European countries (Slovenia, Albania, Denmark and Netherlands) showed the greatest average decreases.
- Increases in climate change stressors (sea surface temperature anomalies, ultraviolet radiation, ocean acidification) caused the highest increases in cumulative impact.
- Impacts from 4 of 5 types of commercial fishing showed decreases of 70-80%.
- All land-based stressors increased globally but were mostly concentrated in coastal areas of only 27 – 52 % of all EEZ’s.
Via oceanhealthindex.org
Cumulative Impact Scores (CIS)
CIS are based on all 19 anthropogenic stressors. Areas of permanent sea ice are shaded white and the area within maximum sea ice extent is masked to indicate where scores are less certain because change in sea ice extent could not be included.
")
Difference between current & earlier cumulative impact scores (2008 - 2013)
Facts:
- Almost 66% of the ocean showed increases of cumulative impact, mostly in tropical, subtropical and coastal regions. The French Territorial holdings in the Indian Ocean, Tanzania and Seychelles showed the most dramatic average increases.
- National waters currently experiencing highest levels of impacts are Singapore, Jordan, Slovenia and Bosnia. Most impacted coastal eco-regions include the Faroe Islands, Eastern Caribbean, Cape Verde and Azore Islands.
- 13% of the ocean experienced decreased impacts, mostly in the Northeast and Central Pacific and Eastern Atlantic. EEZ’s of several South Pacific Islands, the Alaskan coast, and several European countries (Slovenia, Albania, Denmark and Netherlands) showed the greatest average decreases.
- Increases in climate change stressors (sea surface temperature anomalies, ultraviolet radiation, ocean acidification) caused the highest increases in cumulative impact.
- Impacts from 4 of 5 types of commercial fishing showed decreases of 70-80%.
- All land-based stressors increased globally but were mostly concentrated in coastal areas of only 27 – 52 % of all EEZ’s.
Via oceanhealthindex.org
This post may contain affiliate links. As an Amazon Associate, I earn from qualifying purchases.