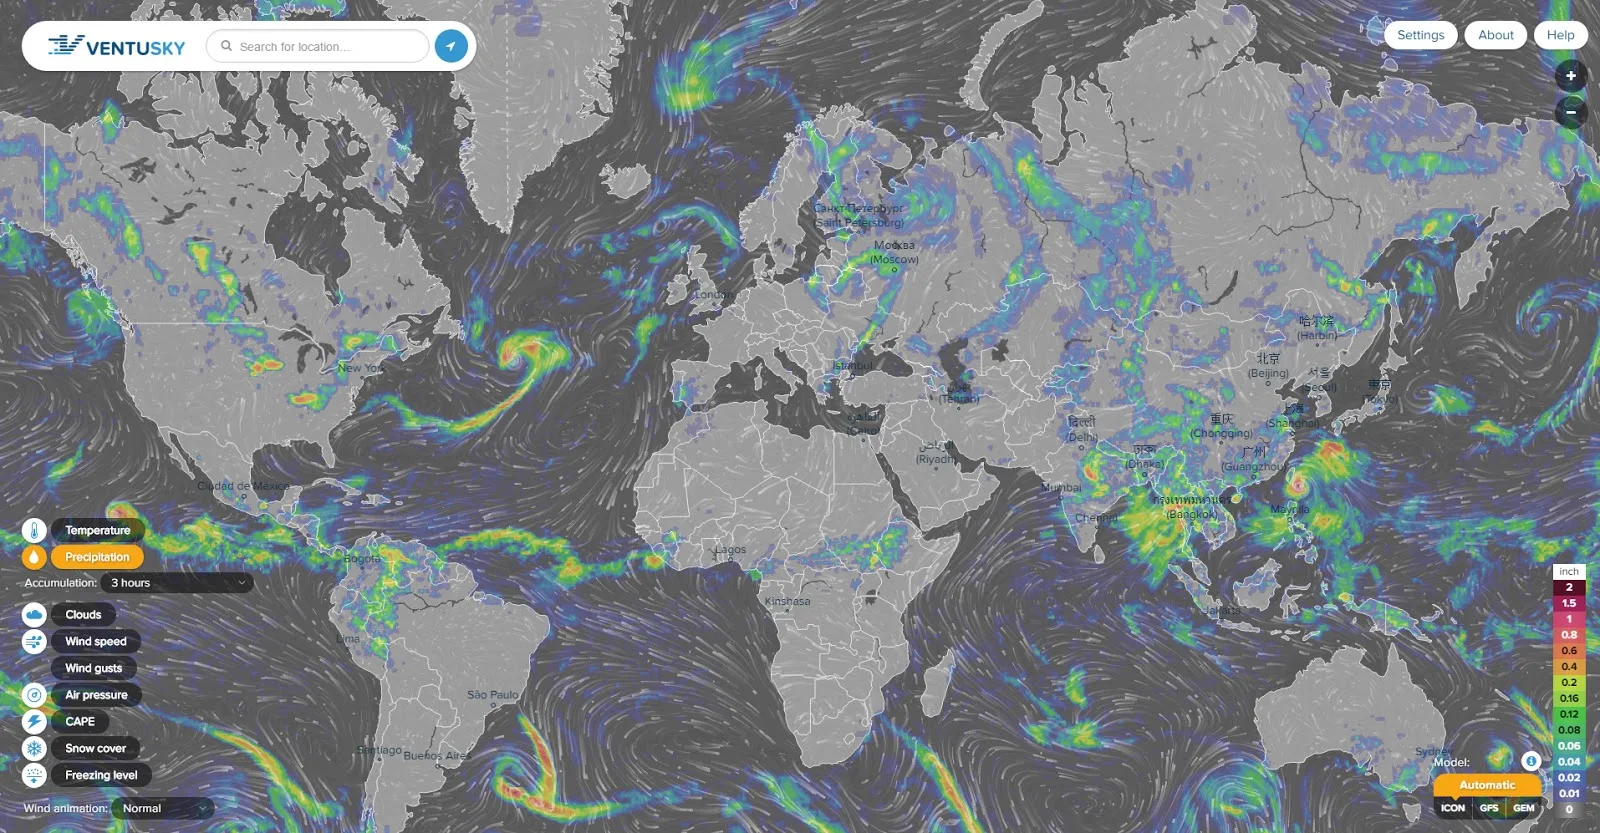
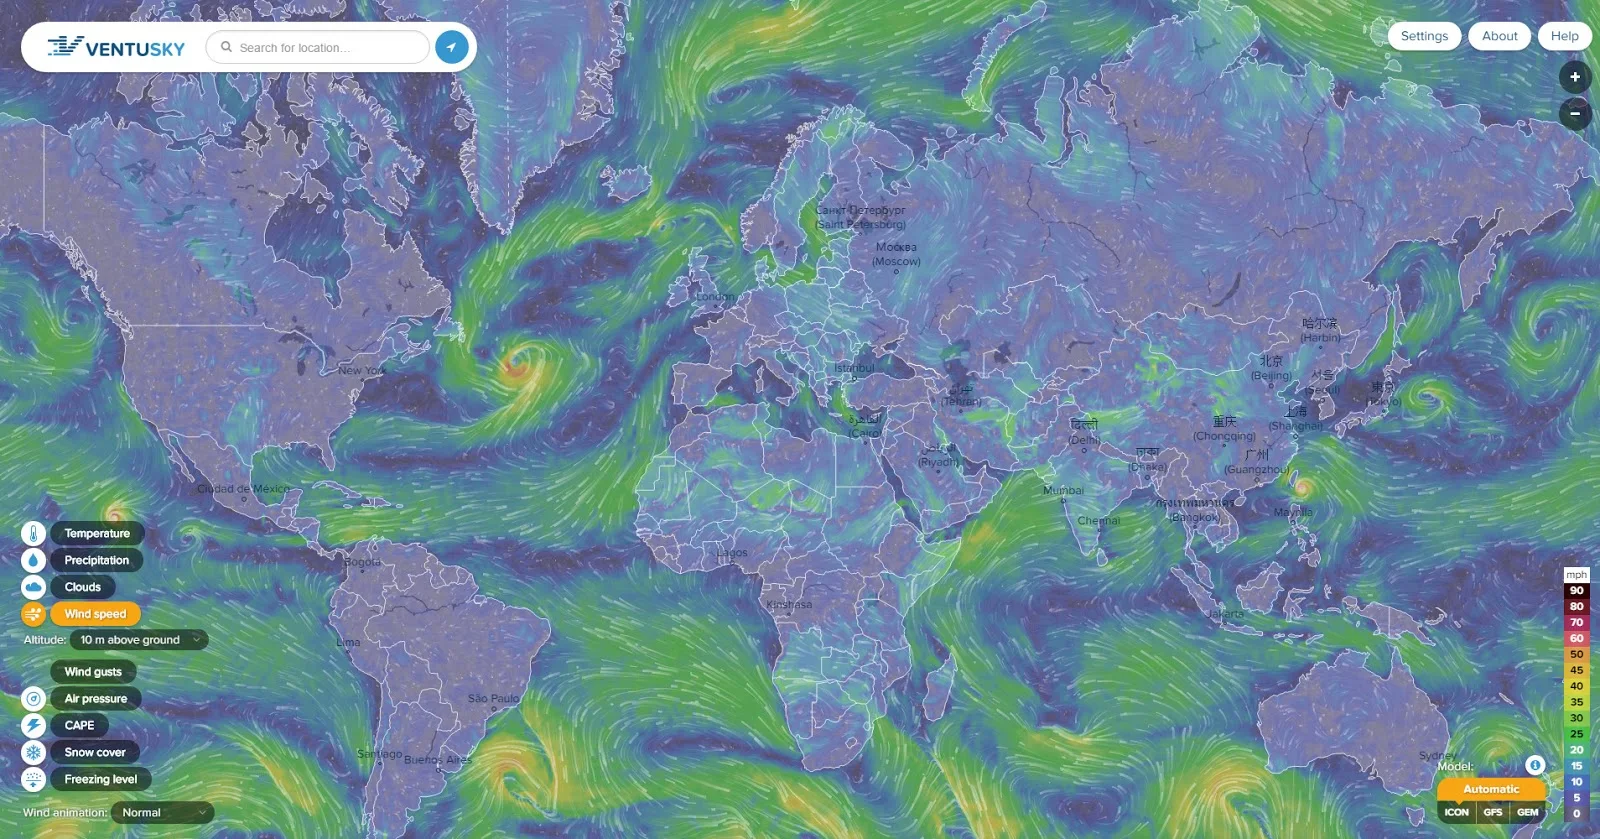
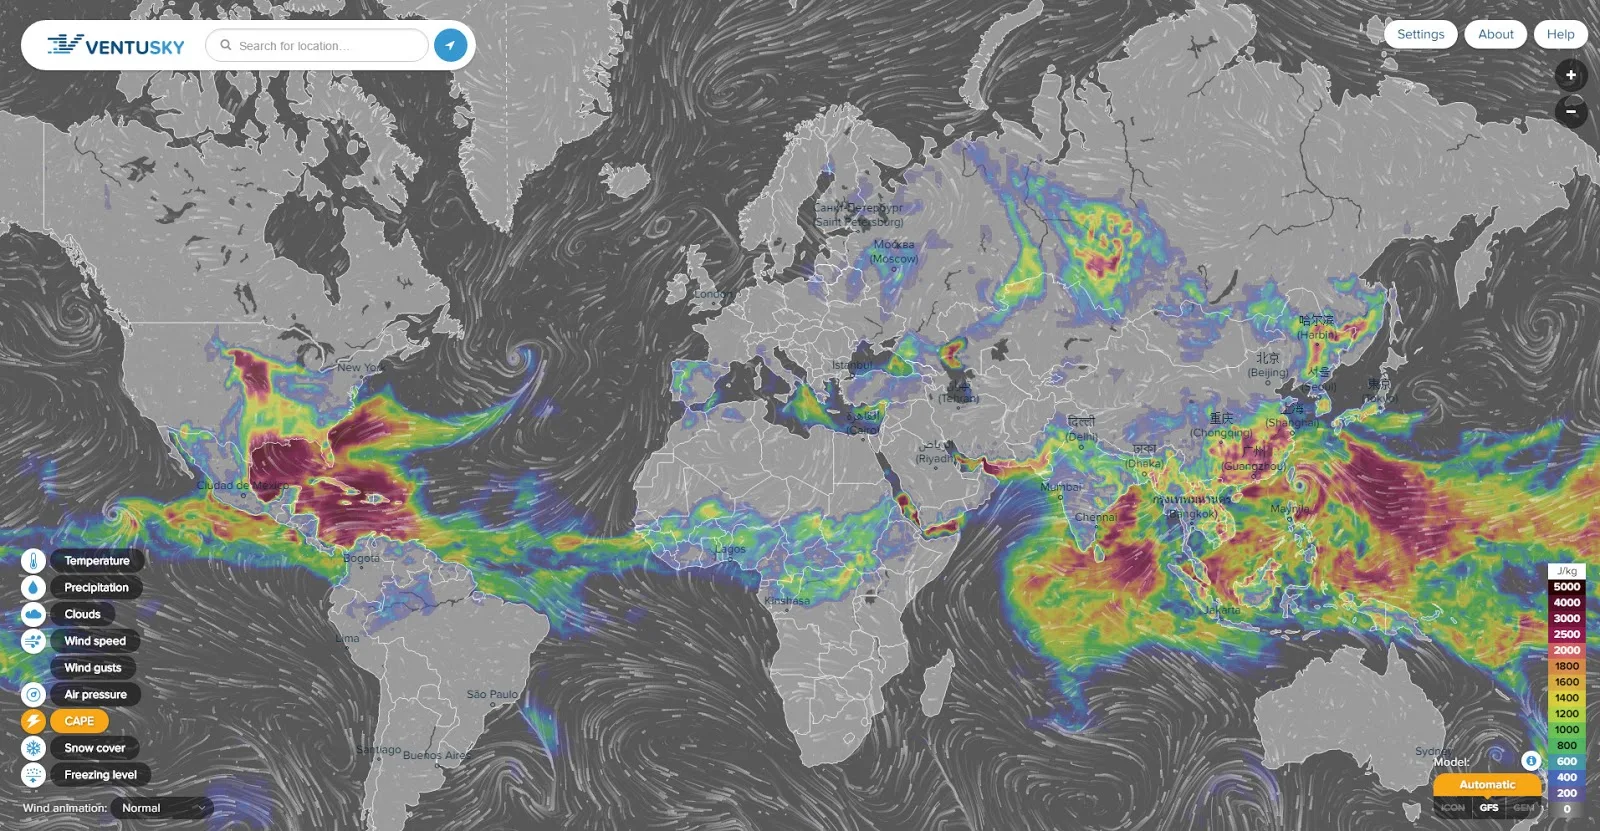
The VentuSky application allows for the illustration of the interdependence of the entire system, displaying the development of pressure, wind, cloud cover, precipitation, and temperature on the map.
The VentuSky application is freely accessible to anyone around the world, aimed at improving awareness about meteorological events in our atmosphere.
Temperature
For this output data, temperature is shown for 2 m above ground. The calculations take into account the terrain (elevation), but with lower resolution than in reality. Therefore the models cannot differentiate, for instance, the temperature on a mountain peak or on a city square scorched by the sun. The general rule is that the centres of large cities are 1 °C to 3 °C warmer than the surrounding area or natural landscapes. Significant temperature differences over a small area are primarily caused in the winter by an inversion. A short yet noticeable cooling can also occur after a local summer storm.
Precipitation
This output data shows the total precipitation in mm for the previous 1 or 3 hours, or from a specific date (accumulated amount). The models do not differentiate more significant precipitation totals in certain mountainous areas or, on the contrary, faint drizzling from fog and low cloud cover. Forecasting precipitation totals for local storms is difficult. The numerical model does not allow for accurate calculations of the formation of local storm cells. In conversions to snowfall, 1 mm of precipitation equals roughly 1 cm of snowfall.
Clouds
This output data shows cloud cover in percentages. Cloud patterns are very difficult to predict. The calculations also include forecasts for high cloud cover. 100% cloud cover signifies an overcast sky. If, however, the sky is overcast with cloud cover that is thin and the sun is shining through, it is still considered overcast, even though it may seem like a sunny day at first glance.
Wind speed
The map illustrates the average wind speed at an altitude 10 m above ground. The calculation does not take into account exposed areas (hilltops, open fields) where wind speed will be greater than that in a city or valley. Localised increases in windiness during storms are also not taken into account in model calculations.
Air pressure
Calculations illustrate air pressure values at sea level. The output data differentiates between pressure highs and lows as well as pressure gradients, which influence wind speed.
CAPE
When there is possibility of storm formation, it is recommended to monitor the values of the CAPE. It represents potential energy in the atmosphere. It helps to establish the level of atmospheric instability. The greater the values reached, the greater the likelihood of the formation of a storm. Values less than 300 are low, between 300 to 1000 are weak, 1000 to 2000 are moderate, and over 2000 are high, when the possibility of the occurrence of strong storms is highly likely. Storm formation is influenced by a number of other factors, however, CAPE is an important indicator.
Snow cover
This data illustrates the anticipated height of snow cover. Prediction of snow cover development is very complex, and the values listed may differ from actual values reached (even by several centimetres). The calculations take into account the terrain (elevation), but with lower resolution than in reality. Therefore, the model cannot display the exact snow cover height in mountainous areas, where it differs greatly.
Freezing level
The altitude in metres (feet) at which the temperature dips below the freezing point is illustrated on the map. This altitude has a large influence on the state of precipitation. At altitudes above this level, precipitation generally occurs in solid states (snowflakes, ice crystals). At lower altitudes, on the contrary, precipitation occurs in a liquid state. This does not, however, always have to be the case. In some instances, snowfall may occur at lower altitudes as well. This is due to the fact that snow does not melt immediately at temperatures above the freezing point, but melts gradually. Therefore, primarily in low humidity, it can snow up to 400 m below this altitude. During temperature inversions, freezing precipitation may fall at this altitude.
MeteoEarth - A 3d weather map


This post may contain affiliate links. As an Amazon Associate, I earn from qualifying purchases.