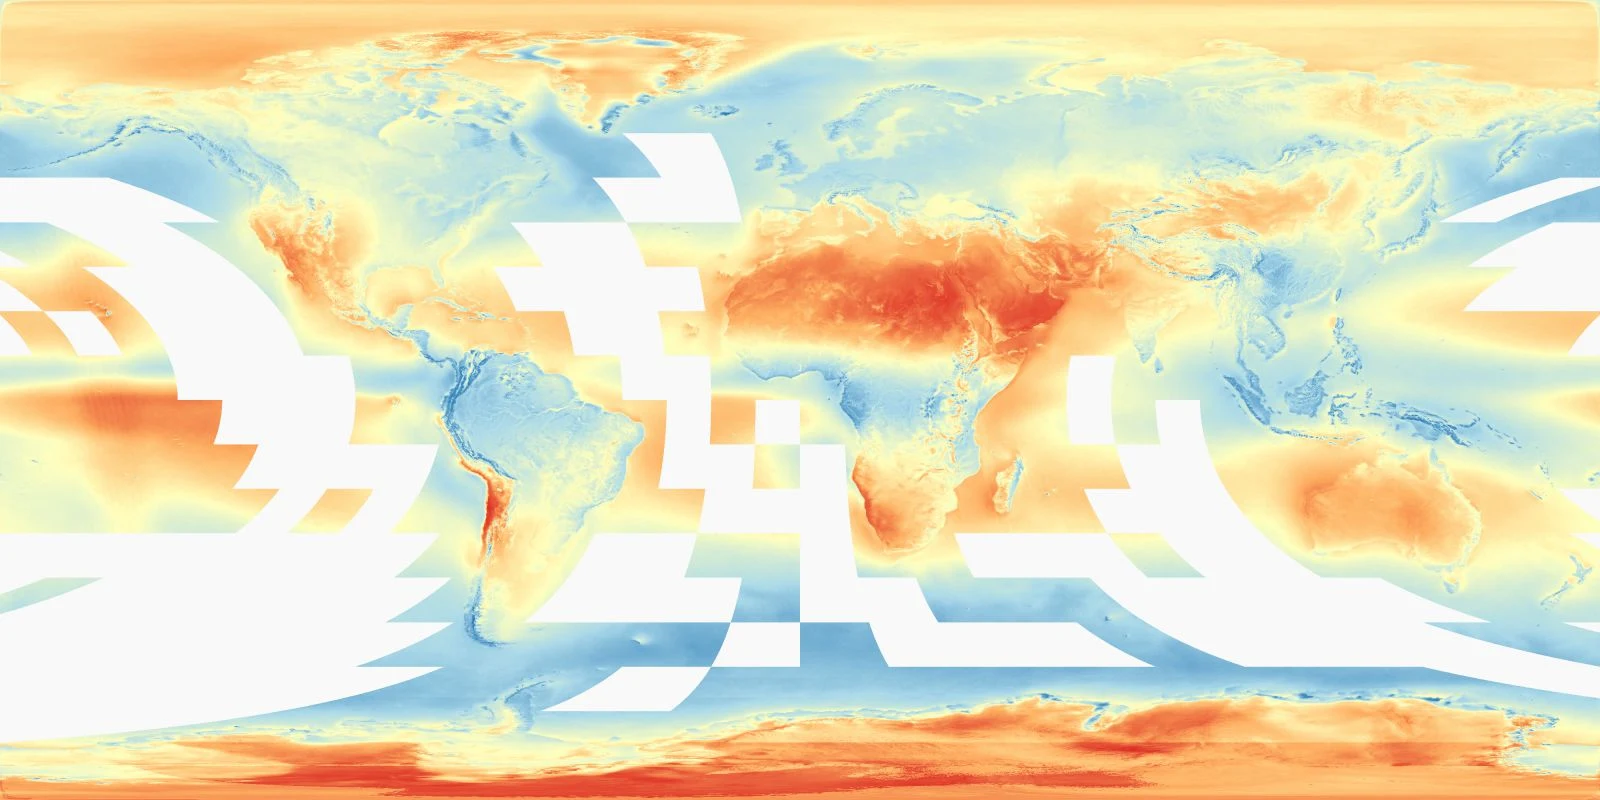
Percent of days that are cloudy each year. The darkest red areas have almost no cloudy days. The darkest blue areas are cloudy nearly every day.
Seasonality of cloud cover. Dark purple areas have the greatest variation in cloud cover from month-to-month.
The map above is the work of two scientists from EarthEnv, a collaborative biodiversity project supported by Yale University, NASA, and others. It shows what percentage of days each year are cloudy, for every place on Earth. To create it they analyzed 15 years of twice-daily satellite measurements. They also used the same data to produce maps that show monthly averages, seasonal variation, and identify areas of near-constant cloud cover.
Like to soak up the sun? You can head to Northern Africa, Saudi Arabia, or Chile. California would also do in a pinch. If you enjoy the shade, the cloudiest places in the world turn out to be South America near the equator, the Congo River basin, and the island nations of Southeast Asia.
Just like a little variety? This other map shows places with the strongest seasonal variation in cloud cover.
In a paper published in PLoS Biology, the authors describe how this data can be used to study and monitor fragile habitats that are crucial for biodiversity, such as cloud forests. These are forested regions with near-constant low-level cloud cover. The dark blue strip along the northwestern edge South America is an example of a cloud forest. As a proof-of-concept they use the new data to improve models of the habitable area for a South American bird and a South African shrub.
Though outside the author’s area of study, the data also accurately describe the extent of an enduring problem with other satellite maps: areas with frequent cloud cover are almost impossible to photograph from space. Compare, for instance, Google Maps’ muddy images of Lagos, Nigeria with its much better images for Johannesburg, South Africa.
Via qz.com
Related posts:
- Using clouds to locate threatened species


This post may contain affiliate links. As an Amazon Associate, I earn from qualifying purchases.
Comments
Post a Comment