So far in the United States, there have been 193 cases of Zika, all of them associated with travel or sexual transmission. According to the Centers for Disease Control and Prevention, no one has yet gotten the virus locally, meaning there haven’t been any cases transmitted by U.S. mosquitoes.
The Aedes aegypti mosquito is the Zika virus’s primary ride. During the winter, the U.S. isn’t a very hospitable environment for the insects, with the exceptions of southern Florida and southern Texas. But it’s now March, and as the weather gets warmer, the mosquitoes can creep farther north.
In a new study published in PLOS Currents: Outbreaks, researchers from the National Center for Atmospheric Research (NCAR) and the University Corporation for Atmospheric Research (UCAR) looked at 50 U.S. cities where the weather could support Aedes aegypti in warmer months.
Zika Risk Levels for U.S. Cities
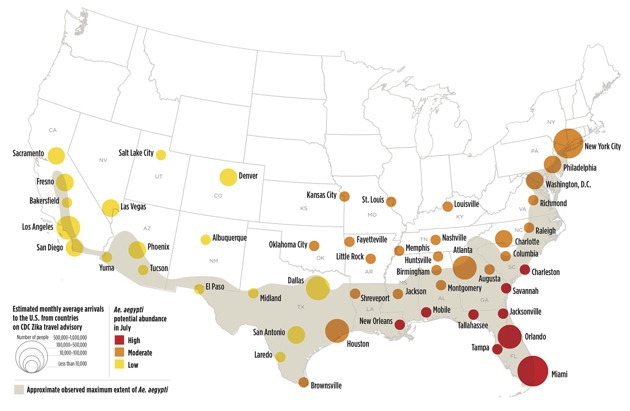 Yellow cities are low-risk, orange are moderate, and red are high. The size of the dot over the city represents how many travelers from current Zika-affected countries come to the city on average each month. And the gray zone represents the area where Aedes aegypti has been observed in earlier years.
To determine which cities would be most at risk and when, the researchers examined a number of factors:
- The estimated abundance of Aedes aegypti mosquitoes per square meter of standing water, based on their life cycle and the historical meteorological conditions in each city (from 2005 to 2015)
- The number of travelers arriving in those cities from Latin American countries currently affected by Zika (although the researchers do note that some people on those flights may have just connected through a Zika-affected country)
- Previous cases of locally transmitted dengue and chikungunya, two other diseases transmitted by Aedes aegypti
- Percentage of households in each city living under the poverty line, which makes people less likely to have air conditioning (Aedes aegypti doesn’t survive well in air-conditioned buildings), safe water, and good sanitation. Irregular garbage collection in some areas may also provide opportunities for the bug to breed.)
- Observations from 1960 to 2014 of the mosquito’s maximum geographic range
Based on their estimates, this is how the year plays out in terms of highest risk for abundant Aedes aegypti populations:
Aedes aegypti Estimated Abundance Over Time
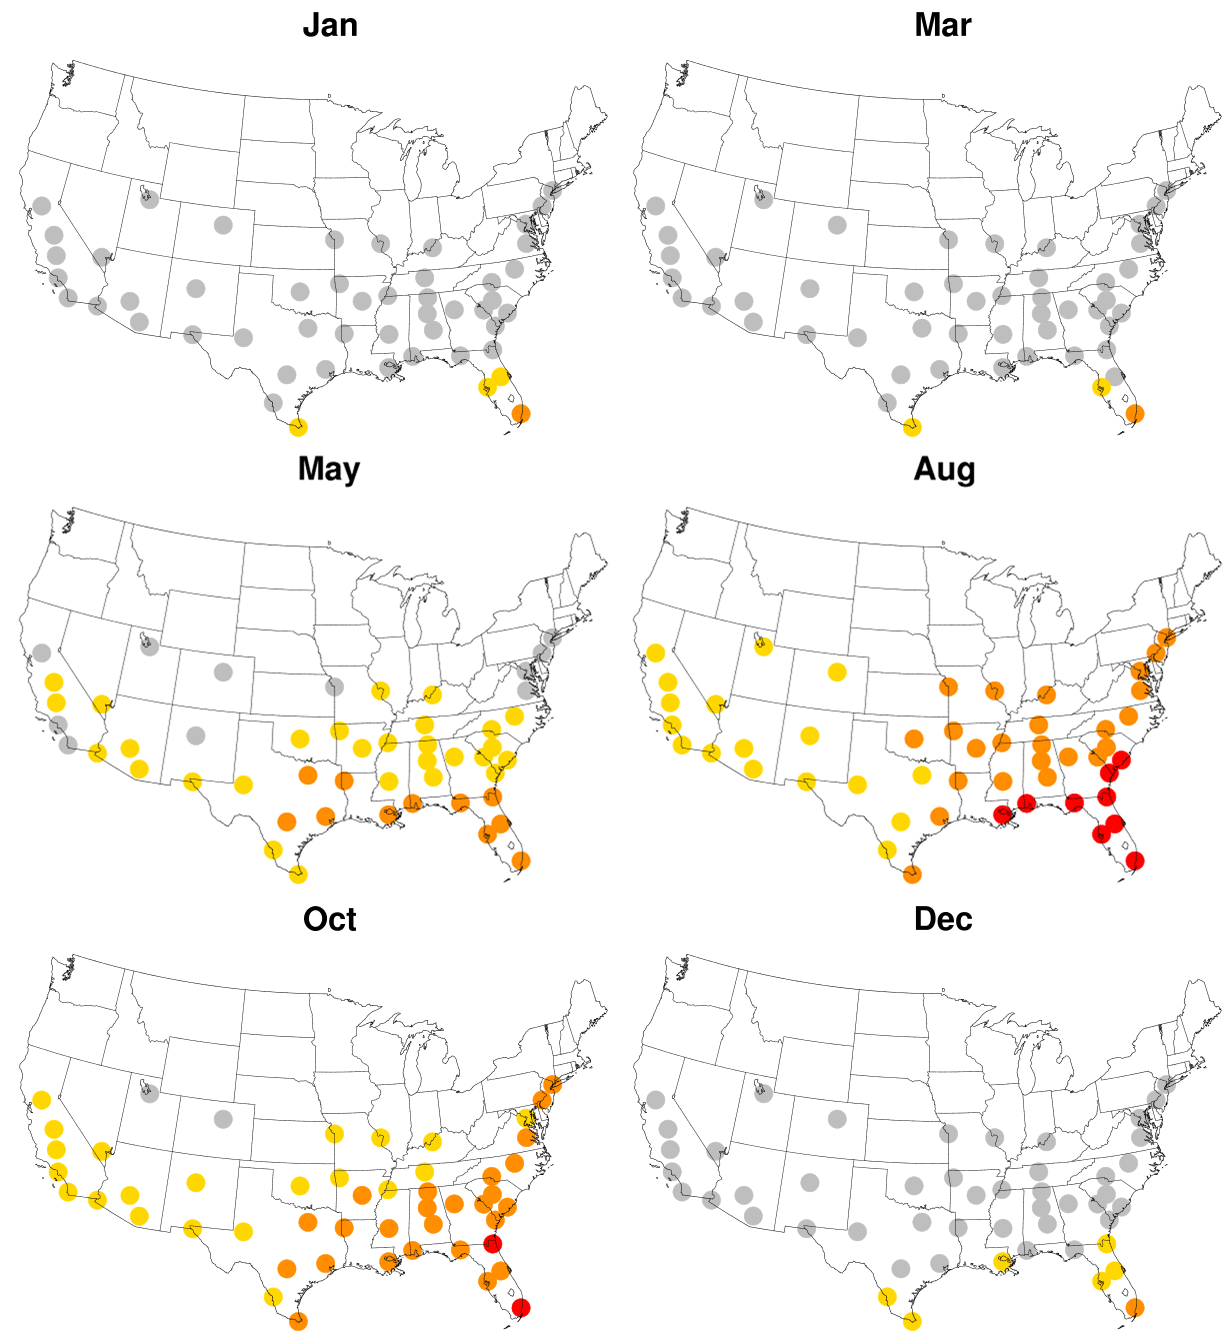 “By mid-July, all 50 cities are meteorologically suitable for Ae. aegypti, with far southeastern cities being suitable for high abundance, and other eastern cities being suitable for moderate-to-high abundance,” the study reads. “Cities in the western U.S. are suitable for low-to-moderate abundance of Ae. aegypti.”
Some of these cities are in places where the mosquito has never been observed before. That doesn’t mean it will travel to those cities, or that it will bring Zika with it if it does - it just means that the weather conditions would be suitable for it to survive and thrive. And though this study doesn’t explicitly take El Niño into account, the researchers write, “it is noteworthy that a seasonal climate forecast … for June-August 2016 suggests a 40-45 percent probability of above-normal temperatures over the entire contiguous U.S. for the upcoming summer of 2016.”
But it’s also worth noting that the models don’t account for mosquito-control methods - so there’s still plenty of room to bring this risk down by spraying for adult mosquitoes, using larvicides, and eliminating mosquito-breeding sites, particularly standing water.
Via theatlantic.com
The Aedes aegypti mosquito is the Zika virus’s primary ride. During the winter, the U.S. isn’t a very hospitable environment for the insects, with the exceptions of southern Florida and southern Texas. But it’s now March, and as the weather gets warmer, the mosquitoes can creep farther north.
In a new study published in PLOS Currents: Outbreaks, researchers from the National Center for Atmospheric Research (NCAR) and the University Corporation for Atmospheric Research (UCAR) looked at 50 U.S. cities where the weather could support Aedes aegypti in warmer months.
Zika Risk Levels for U.S. Cities

To determine which cities would be most at risk and when, the researchers examined a number of factors:
- The estimated abundance of Aedes aegypti mosquitoes per square meter of standing water, based on their life cycle and the historical meteorological conditions in each city (from 2005 to 2015)
- The number of travelers arriving in those cities from Latin American countries currently affected by Zika (although the researchers do note that some people on those flights may have just connected through a Zika-affected country)
- Previous cases of locally transmitted dengue and chikungunya, two other diseases transmitted by Aedes aegypti
- Percentage of households in each city living under the poverty line, which makes people less likely to have air conditioning (Aedes aegypti doesn’t survive well in air-conditioned buildings), safe water, and good sanitation. Irregular garbage collection in some areas may also provide opportunities for the bug to breed.)
- Observations from 1960 to 2014 of the mosquito’s maximum geographic range
Based on their estimates, this is how the year plays out in terms of highest risk for abundant Aedes aegypti populations:
Aedes aegypti Estimated Abundance Over Time

Some of these cities are in places where the mosquito has never been observed before. That doesn’t mean it will travel to those cities, or that it will bring Zika with it if it does - it just means that the weather conditions would be suitable for it to survive and thrive. And though this study doesn’t explicitly take El Niño into account, the researchers write, “it is noteworthy that a seasonal climate forecast … for June-August 2016 suggests a 40-45 percent probability of above-normal temperatures over the entire contiguous U.S. for the upcoming summer of 2016.”
But it’s also worth noting that the models don’t account for mosquito-control methods - so there’s still plenty of room to bring this risk down by spraying for adult mosquitoes, using larvicides, and eliminating mosquito-breeding sites, particularly standing water.
Via theatlantic.com
This post may contain affiliate links. As an Amazon Associate, I earn from qualifying purchases.
Comments
Post a Comment