Access to clean and safe water is a fundamental human right, yet billions of people around the world still struggle with water scarcity. Understanding the global landscape of water access is crucial for addressing this critical issue. Here, we delve into fascinating facts and insights about the state of water access worldwide.
Fascinating Facts About Global Water Access
- Water Scarcity Affects Over 40% of the Global Population: According to the United Nations, water scarcity impacts more than 40%40% of the global population and is projected to rise. This is due to factors like population growth, climate change, and increased water demand.
- Sub-Saharan Africa Faces the Greatest Challenges: In Sub-Saharan Africa, approximately 400 million people lack access to basic drinking water services. Rural areas are particularly affected, with only 24%24% of the rural population having access to safe drinking water.
- Asia’s Urban Water Struggles: In Asia, urbanization is putting a strain on water resources. Cities like Mumbai, Jakarta, and Beijing face severe water shortages due to rapid population growth and pollution of water sources.
- Desalination: A Growing Trend: Desalination, the process of removing salt from seawater, is becoming an increasingly important source of fresh water. Countries in the Middle East, like Saudi Arabia and the UAE, rely heavily on desalination plants to meet their water needs.
- Innovative Solutions in Africa: Innovations such as solar-powered water purification systems and mobile water ATMs are being deployed in Africa to improve water access. These technologies provide affordable and sustainable solutions to communities in need.
- Impact of Climate Change: Climate change is exacerbating water scarcity by altering precipitation patterns and increasing the frequency of droughts. This affects water availability for agriculture, industry, and domestic use.
- Water Access and Health: Lack of access to clean water contributes to waterborne diseases such as cholera, dysentery, and typhoid fever. Every year, millions of people, particularly children, die from diseases related to unsafe water and poor sanitation.
The visualization below shows water access worldwide.
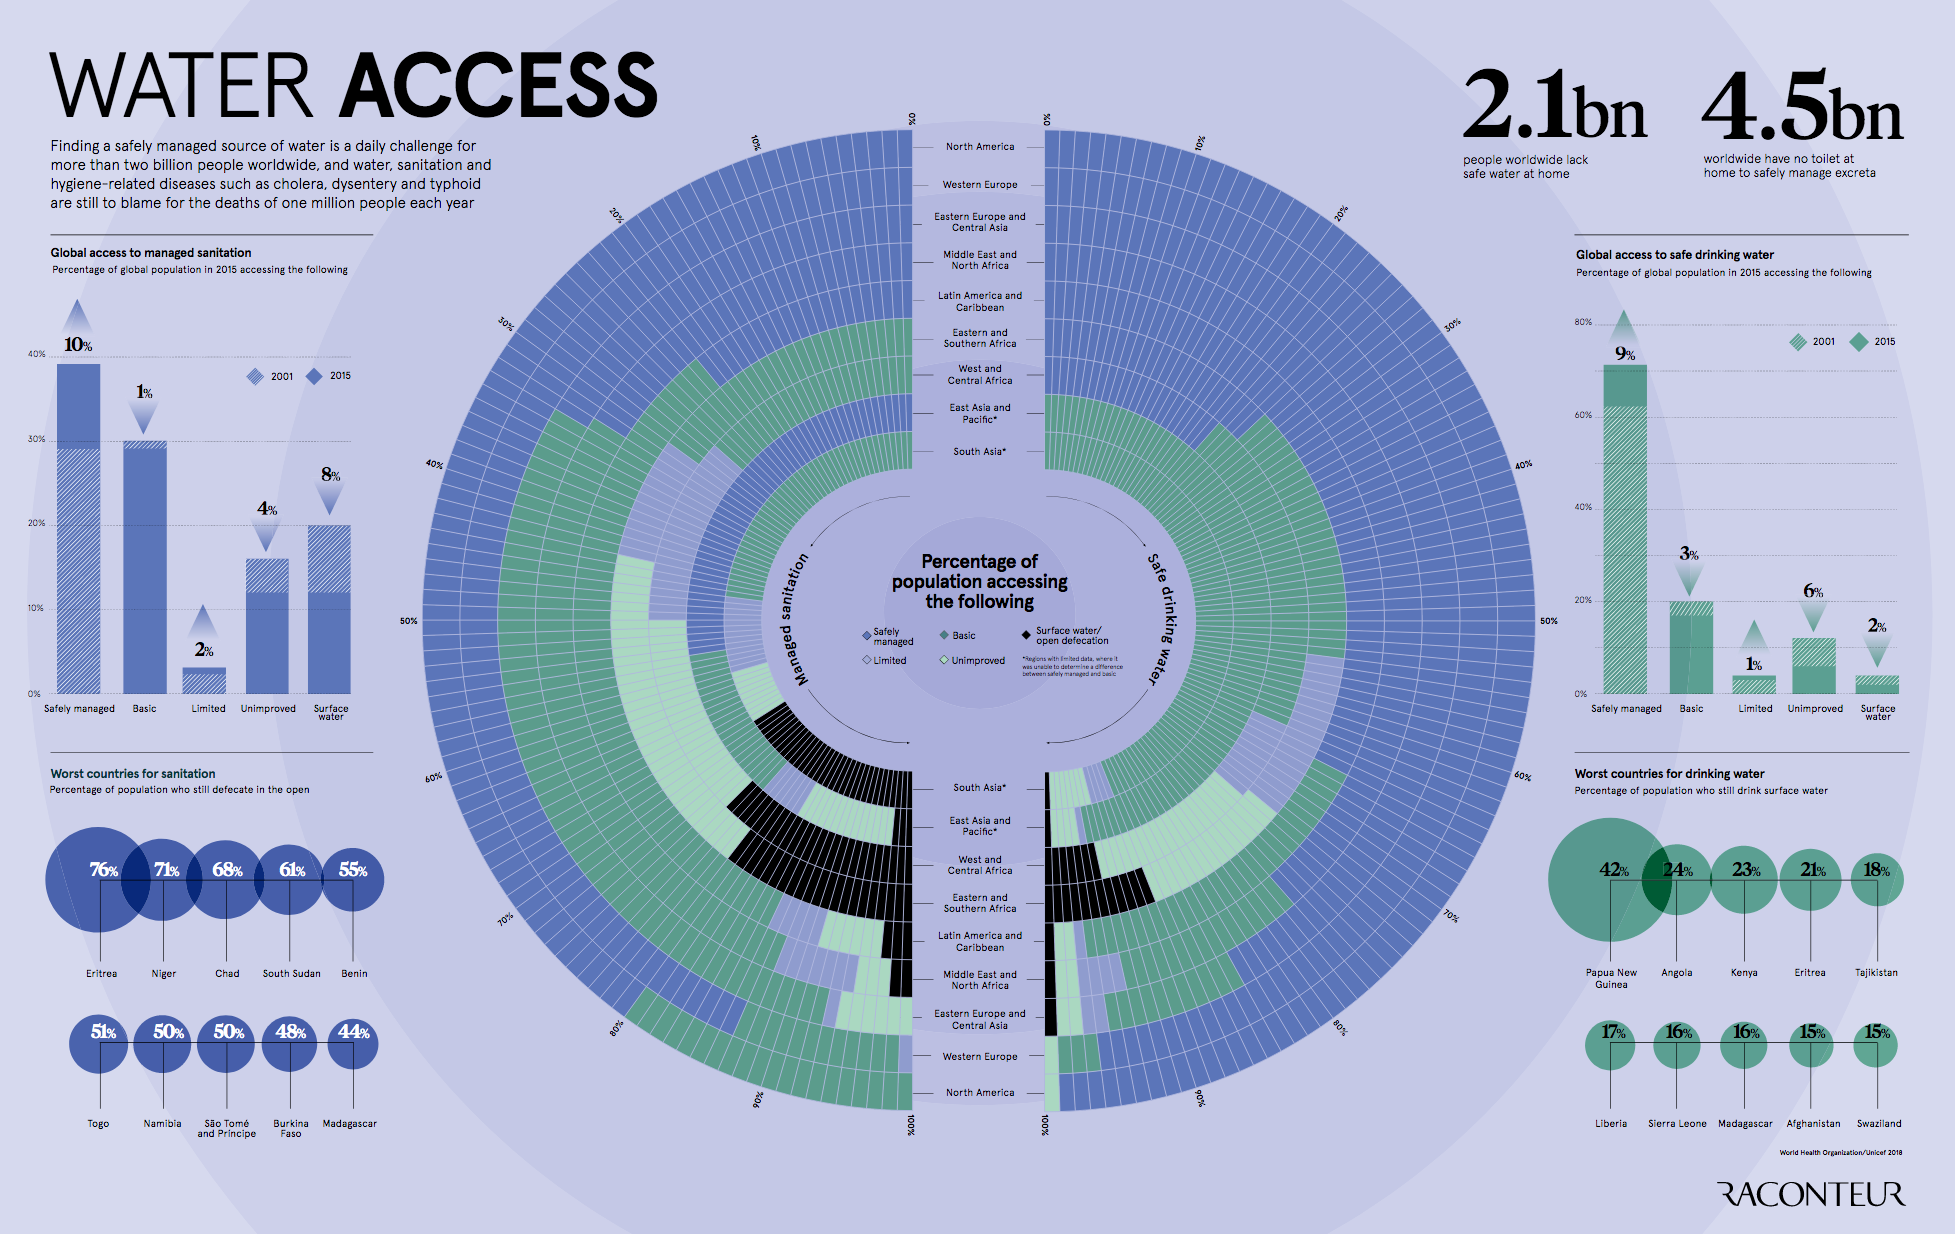
According to this visualization, 2.1 billion people worldwide lack safe water at home. 4.5 billion people worldwide have no toilet at home to safely manage excreta.
Worst countries for drinking water (Percentage of population who still drink surface water):
1. Papua New Guinea - 42%
2. Angola - 24%
3. Kenya - 23%
4. Eritrea - 21%
5. Tajikistan - 18%
6. Liberia - 17%
7. Sierra Leone - 16%
8. Madagascar - 16%
9. Afghanistan - 15%
10. Swaziland - 15%
Worst countries for sanitation (Percentage of population who still defecate in the open):
1. Eritrea - 76%
2. Niger - 71%
3. Chad - 68%
4. South Sudan - 61%
5. Benin - 55%
6. Togo - 51%
7. Namibia - 50%
8. Sao Tome and Principe - 50%
9. Burkina Faso - 48%
10. Madagascar - 44%
Initiatives and Solutions
- Sustainable Development Goal 6: The United Nations’ Sustainable Development Goal 6 aims to ensure the availability and sustainable management of water and sanitation for all by 2030. This includes targets for improving water quality, increasing water-use efficiency, and protecting water-related ecosystems.
- Community-Led Projects: Grassroots initiatives and community-led projects play a crucial role in improving water access. Local involvement ensures that solutions are tailored to the specific needs and conditions of the community.
- Technology and Innovation: Advances in technology, such as water filtration systems, rainwater harvesting, and smart water management, are helping to address water scarcity. Innovations in these areas can provide scalable and sustainable solutions.
- International Cooperation: Cross-border water management and international cooperation are essential for managing shared water resources. Treaties and agreements between countries help to ensure equitable and sustainable use of transboundary rivers and aquifers.
This post may contain affiliate links. As an Amazon Associate, I earn from qualifying purchases.