
Modern Human Variation: Distribution of Blood Types

Distribution of the B type blood allele in native populations of the world

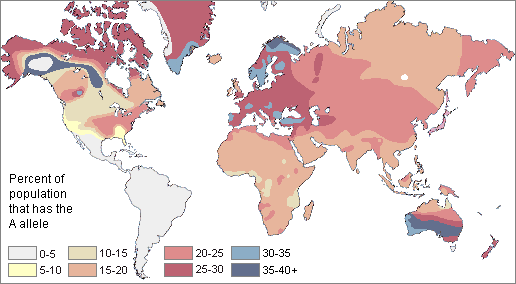
Distribution of the A type blood allele in native populations of the world

Distribution of the O type blood in native populations of the world


The majority of the people in the world have the Rh+ blood type. However, it is more common in some regions. Native Americans and Australian Aborigines were very likely 99-100% Rh+ before they began interbreeding with people from other parts of the world. This does not imply that Native Americans and Australian Aborigines are historically closely related to each other. Most Subsaharan African populations are around 97-99% Rh+. East Asians are 93-99+% Rh+. Europeans have the lowest frequency of this blood type for any continent. They are 83-85% Rh+. The lowest known frequency is found among the Basques of the Pyrenees Mountains between France and Spain. They are only 65% Rh+.


The distribution patterns for the Diego click this icon to hear the preceding term pronounced blood system are even more striking. Evidently, all Africans, Europeans, East Indians, Australian Aborigines, and Polynesians are Diego negative. The only populations with Diego positive people may be Native Americans (2-46%) and East Asians (3-12%). This nonrandom distribution pattern fits well with the hypothesis of an East Asian origin for Native Americans.


The implication is that the specific causes responsible for the distribution of human blood types have been different than those for other traits that have been commonly employed to categorize people into "races." Since it would be possible to divide up humanity into radically different groupings using blood typing instead of other genetically inherited traits such as skin color, we have more conclusive evidence that the commonly used typological model for understanding human variation is scientifically unsound.


Via anthro.palomar.edu

This post may contain affiliate links. As an Amazon Associate, I earn from qualifying purchases.


Popular posts from this blog

Find cities with similar climate

This map has been created using The Global environmental stratification. The Global environmental stratification (GEnS), based on statistical clustering of bioclimate data (WorldClim). GEnS, consists of 125 strata, which have been aggregated into 18 global environmental zones (labeled A to R) based on the dendrogram. Interactive map >> Via www.vividmaps.com Related posts: -  Find cities with similar climate 2050 -  How global warming will impact 6000+ cities around the world?

How Cold Can It Get? The Lowest Temperatures Ever Recorded, Mapped

We often talk about record heat , especially in the context of climate change. But on the flip side, our planet also experiences cold so extreme it defies belief—temperatures that can flash-freeze exposed skin and halt life as we know it. These are not just numbers on thermometers; they’re snapshots of how Earth's atmosphere behaves under specific conditions—altitude, wind patterns, and location far from the moderating effects of oceans. The coldest temperature ever recorded on Earth? That title goes to Vostok Station in Antarctica, where scientists measured a bone-cracking −89.2°C (−128.6°F) on July 21, 1983. Located on the East Antarctic Plateau, Vostok is more than 1,000 kilometers from the South Pole and sits atop about 3.7 kilometers (2.3 miles) of ice. It’s isolated, dry, and high—three ingredients that make for perfect deep freeze conditions. The world map below created by VividMaps shows the lowest temperature ever recorded by country. The Coldest Inhabited Place on Earth...

Mapping the Hottest Temperatures Ever Recorded on Earth

 When summer arrives, it brings not only vacation season but also some of the most extreme heat waves across the globe. While many people associate summer with warm, sunny days, some regions endure scorching temperatures that push the limits of human endurance. To put these extremes into perspective, we’ve mapped the highest temperatures ever recorded in countries around the world. The maps below, created by Vivid Maps , illustrate these record-breaking temperatures and the patterns of extreme heat across the globe. The Hottest Temperature on Record According to historical weather data, the highest reliably recorded temperature on Earth is 56.7°C (134°F) , measured in Death Valley, California , on July 10, 1913 . However, an even higher temperature of 58°C (136.4°F) was reportedly recorded in El Azizia, Libya , on September 13, 1922 . While this Libyan record stood for decades, some meteorologists have questioned its accuracy due to inconsistencies in measurement methods at the ti...