Dangerous heat waves have emerged as a recurring and alarming phenomenon in the United States. These extreme heat events are characterized by extended periods of scorching temperatures that can have profound impacts on both human health and the environment. Over recent decades, there has been a noticeable uptick in the frequency, duration, and intensity of these heat waves, affecting various regions across the country, including the Pacific Northwest, the Southeast, and even traditionally cooler areas.
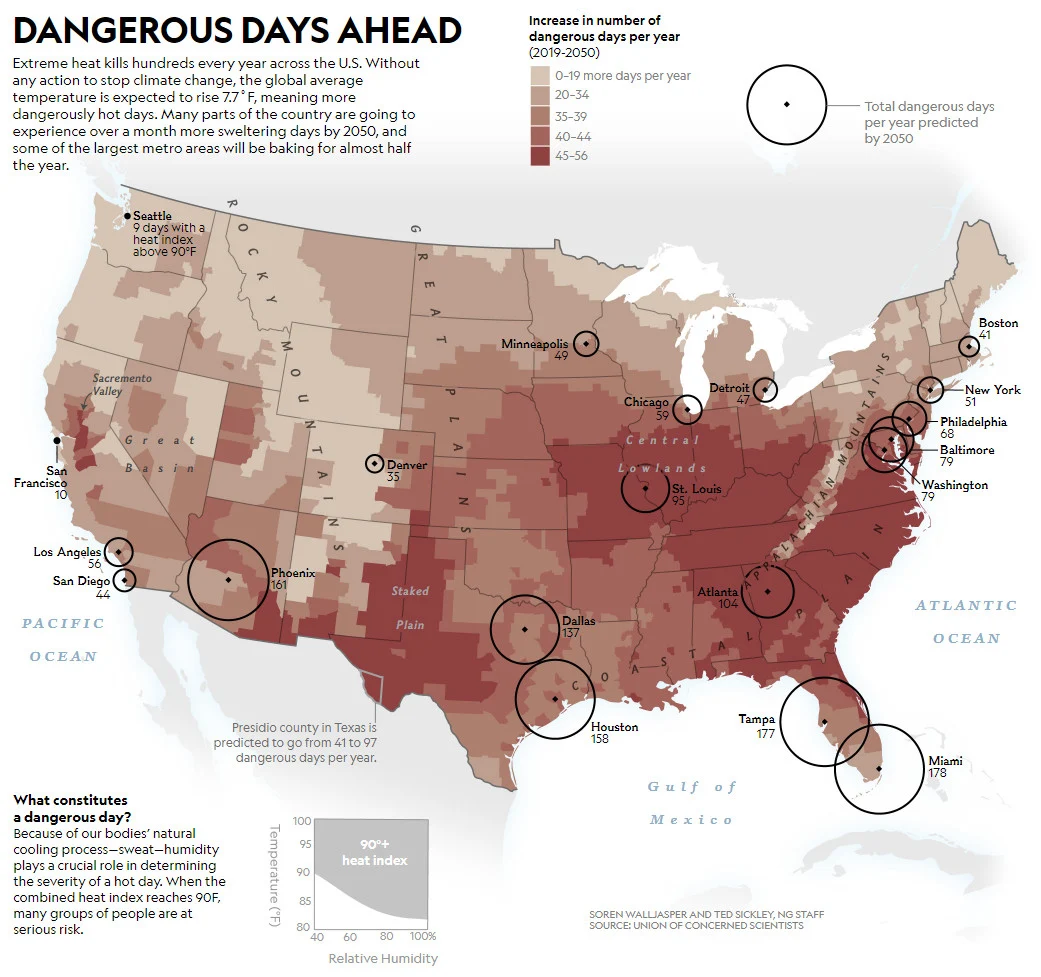
The map below created by nationalgeographic.com shows increase in number of dangerous days per year from 2019 to 2050.
One of the most pressing concerns associated with heat waves is their significant threat to public health. Vulnerable populations, including the elderly, young children, and individuals with pre-existing medical conditions, are particularly at risk. Heat-related illnesses, such as heat exhaustion and heatstroke, can quickly escalate to life-threatening conditions if not addressed promptly. Consequently, during extreme heat events, there is often a surge in the number of heat-related fatalities, with vulnerable communities bearing the brunt of these tragic outcomes.
According to National Geographic, each year, severe heat claims the lives of hundreds of individuals throughout the United States. Without proactive measures to combat global warming, the worldwide average temperature is projected to increase by 7.7˚F, resulting in a greater number of extremely hot days. By 2050, numerous regions across the nation are expected to experience over a month's worth of additional scorching days, and some major cities may find themselves enduring nearly half the year under the relentless heat.
Beyond the immediate health risks, dangerous heat waves also have far-reaching economic consequences. They can disrupt agricultural activities, reduce labor productivity, strain energy resources as people rely more on air conditioning, and damage critical infrastructure, including roads and power lines. This places additional burdens on local economies and can exacerbate existing socioeconomic disparities.
The connection between heat waves and climate change is a well-established one. Rising global temperatures and altered weather patterns contribute to the increased likelihood of more frequent and severe heat events. Additionally, urban areas tend to experience even higher temperatures during heat waves due to the urban heat island effect. This phenomenon occurs when buildings, concrete, and asphalt absorb and retain heat, causing cities to become significantly warmer than their surrounding rural areas.
To address the challenges posed by dangerous heat waves, governments at the federal, state, and local levels have been working to improve heat wave preparedness and response plans. These initiatives often include the establishment of cooling centers, public education campaigns, and early warning systems designed to alert residents to impending heat waves. However, there is also a growing emphasis on long-term strategies, such as climate adaptation and mitigation efforts, which seek to reduce greenhouse gas emissions, increase green spaces in urban areas, and improve urban planning to mitigate the effects of heat.
Public awareness plays a critical role in this effort, as individuals must be educated about the risks of extreme heat and how to protect themselves during heat waves. This includes staying hydrated, seeking shade, and limiting outdoor activities during peak heat hours. Furthermore, addressing the equity dimensions of heat wave impacts is essential. Vulnerable communities, often those with limited access to resources and healthcare, face disproportionate risks during extreme heat events, necessitating targeted interventions to reduce disparities.
And if you’re looking to buy weather station you can still find it on Amazon here.
- Newentor Weather Station Wireless Indoor Outdoor Thermometer, Color Display Digital Weather Thermometer with Atomic Clock, Forecast Station with Calendar and Adjustable Backlight
- Indoor Outdoor Thermometer Hygrometer Wireless Weather Stations, Temperature Humidity Monitor Battery Powered Inside Outside Thermometer with 330ft Range Remote Sensor and Blacklight Display
- La Crosse Technology C85845-INT Weather Station, Black

This post may contain affiliate links. As an Amazon Associate, I earn from qualifying purchases.