Air pollution presents significant challenges to human health and well-being, impacting atmospheric visibility and exacerbating climate change. With the escalation of social and economic activities, human-induced PM2.5 pollution from intensive human actions has resulted in severe air pollution.
PM2.5 pollution refers to particulate matter that has a diameter of 2.5 micrometers or smaller. It comprises an intricate blend of solids and aerosols, including tiny liquid droplets, dry solid particles, and solid cores coated with liquid. These particles are minuscule and can remain suspended in the air for long periods, making them easily inhalable. PM2.5 pollution primarily originates from sources such as vehicle exhaust, industrial emissions, construction activities, and wildfires.
Exposure to PM2.5 pollution is associated with a range of adverse health effects, including respiratory and cardiovascular problems. When inhaled, these fine particles can penetrate deep into the lungs and even enter the bloodstream, causing inflammation and damage to lung tissue. Long-term exposure to PM2.5 pollution has been linked to an increased risk of developing respiratory diseases such as asthma, bronchitis, and lung cancer, as well as cardiovascular diseases such as heart attacks and strokes.
Studies have shown that exposure to PM2.5 pollution is also associated with reduced life expectancy. Prolonged exposure to high levels of PM2.5 pollution can contribute to premature mortality by exacerbating existing health conditions and increasing the risk of developing new ones. Additionally, PM2.5 pollution is a significant contributor to air pollution-related deaths worldwide, making it a critical public health concern.
The World Health Organization (WHO) PM2.5 guideline provides recommendations for air quality standards concerning fine particulate matter with a diameter of 2.5 micrometers or smaller (PM2.5). The guideline establishes a threshold for PM2.5 concentration levels in outdoor air to protect public health. According to the WHO, exposure to PM2.5 pollution should be limited to an annual mean concentration of 10 micrograms per cubic meter (µg/m³) and a 24-hour mean concentration of 25 µg/m³ to minimize adverse health effects.
Several regions and countries around the world are known for having high levels of PM2.5 pollution, often due to factors such as industrial activity, vehicular emissions, urbanization, and geographic features that contribute to air pollution concentration.
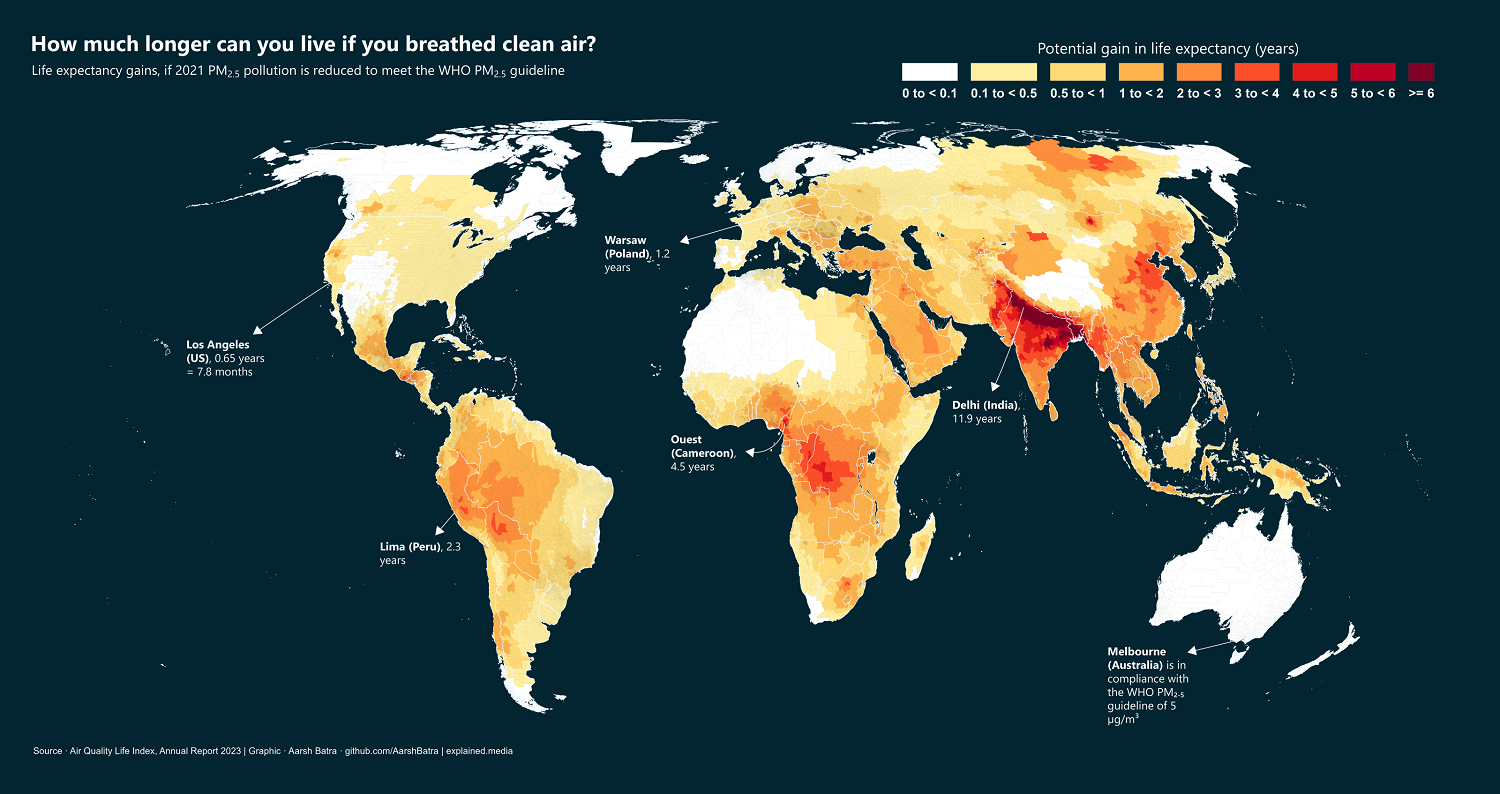
The map below, created by Aarsh Batra, clearly illustrates the most polluted regions of our planet, showing the potential life expectancy gains if 2021 PM2.5 pollution is reduced to meet the WHO PM2.5 guideline.
According to the map some of the regions and countries with the least clean air in terms of PM2.5 pollution include:
- South Asia: Countries such as India, Bangladesh, and Pakistan experience severe PM2.5 pollution levels, particularly in densely populated urban areas with high levels of industrialization and vehicular traffic.
- East Asia: China is known for its significant air pollution challenges, with PM2.5 pollution being a major concern, especially in cities like Beijing and Shanghai. Industrial emissions, coal combustion, and urbanization contribute to high levels of PM2.5 pollution in the region.
- Southeast Asia: Countries like Indonesia, Vietnam, and Thailand also grapple with high levels of PM2.5 pollution, often exacerbated by factors such as agricultural burning, urban development, and industrial activity.
- Middle East: Urban areas in countries like Iran, Iraq, and Saudi Arabia face elevated PM2.5 pollution levels due to factors such as industrial emissions, dust storms, and desertification.
- Africa: Urban centers in countries such as Nigeria, Egypt, and South Africa experience PM2.5 pollution, driven by industrial activity, urbanization, biomass burning, and traffic congestion.

This post may contain affiliate links. As an Amazon Associate, I earn from qualifying purchases.
Comments
Post a Comment