The Unequal Distribution of Global Precipitation

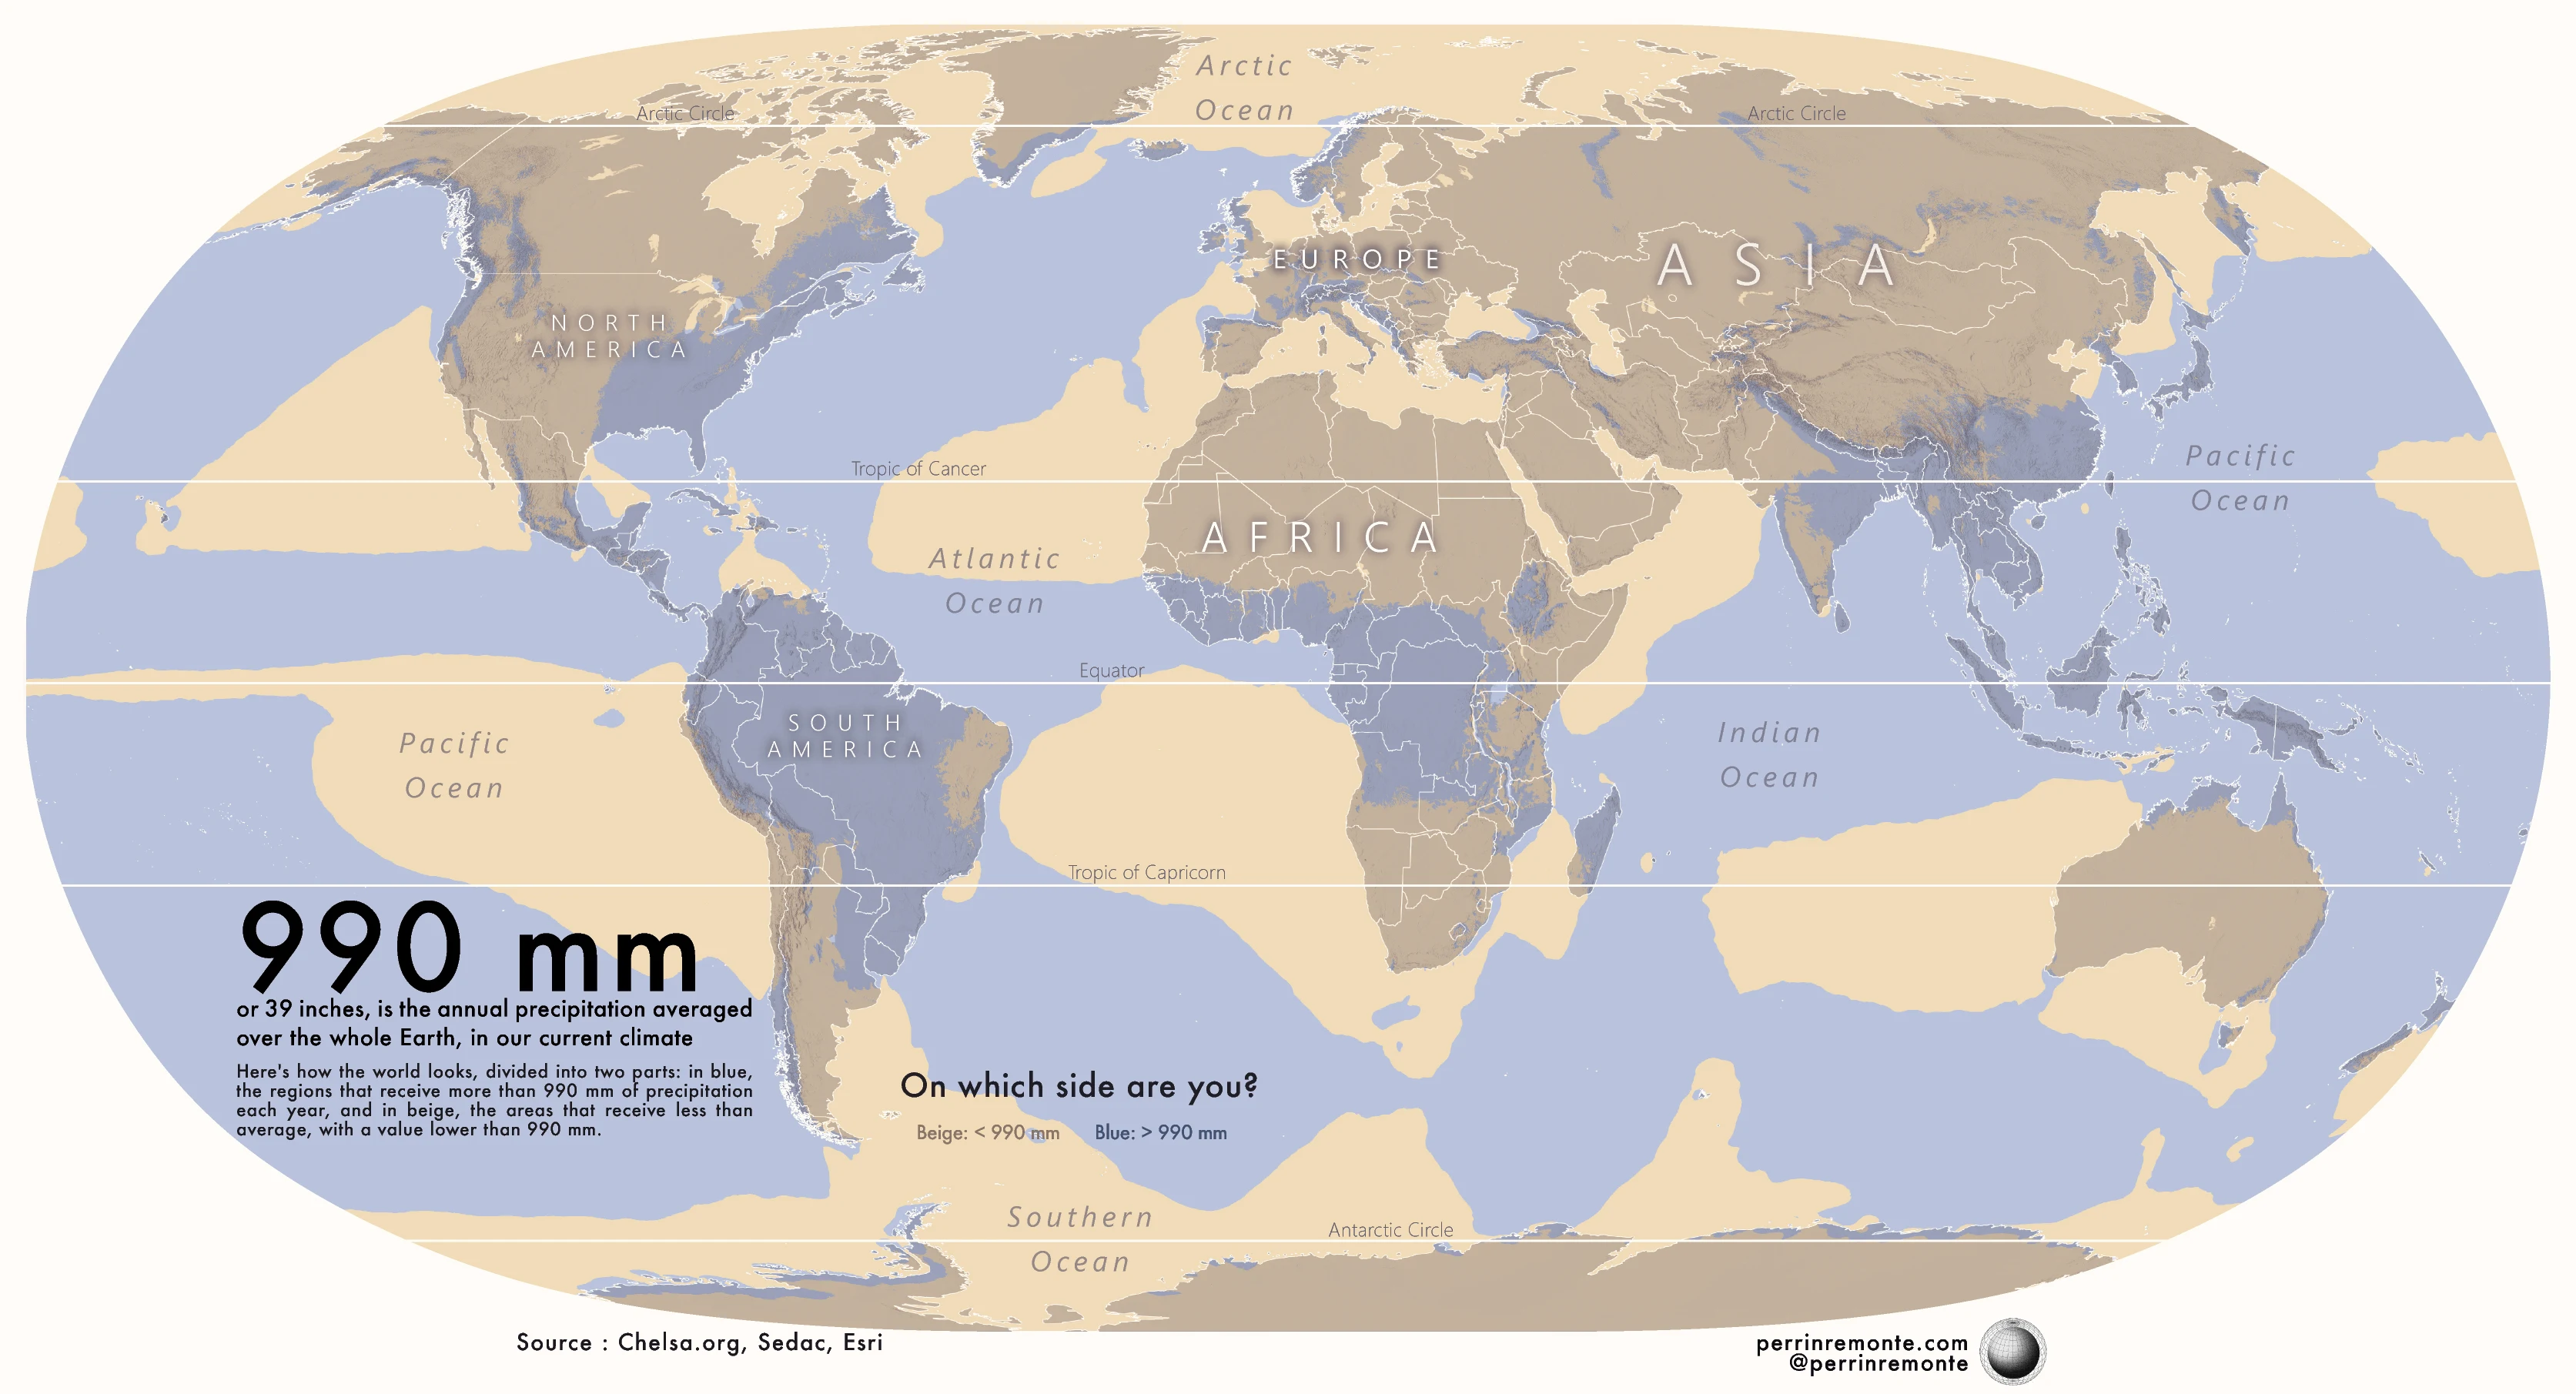
Typically, the Earth experiences an annual precipitation of approximately one meter (39 inches) in the form of rain or snow. Nevertheless, variations in factors such as latitude, wind patterns, alterations in the Earth's surface, and the planet's axial tilt result in an uneven distribution of global precipitation.Typically, the Earth experiences an annual precipitation of approximately one meter (39 inches) in the form of rain or snow. Nevertheless, variations in factors such as latitude, wind patterns, alterations in the Earth's surface, and the planet's axial tilt result in an uneven distribution of global precipitation.

To illustrate this phenomenon, cartographer Perrin Remonté utilizes information from Chelsea Climate. The world is divided into two sections for visualization purposes. The first half, depicted in blue, receives an annual precipitation of more than one meter (rain or snow), while the second half receives less.


The Unequal Distribution of Global Precipitation

Derived from the water cycle, precipitation initiates with evaporation. However, for moist air to transform into rain (or snow), it must first cool and condense. Here are some key factors that significantly influence precipitation:

  • Lower Latitudes: Regions situated at or near the equator experience higher temperatures, leading to increased evaporation from nearby water bodies.
  • Topography: Mountain ranges, particularly those along coastlines, compel warm air to ascend and cool, resulting in precipitation like rain or snow on the windward side and arid rain shadows on the leeward side.
  • Trade Winds: Steady easterly surface winds, originating from subtropical high-pressure zones and blowing towards the equator, transport moist air from the ocean to the land.

Top 10 countries with the highest average precipitation, mm

  1. Colombia: 3,240
  2. Sao Tome & Principe: 3,200
  3. Papua New Guinea: 3,142
  4. Solomon Islands: 3,028
  5. Panama: 2,928
  6. Costa Rica: 2,926
  7. Samoa: 2,880
  8. Malaysi:a 2,875
  9. Brunei Darussalam: 2,722
  10. Indonesia: 2,702
According to the World bank data, leading the rankings, Colombia encountered 3,240 millimeters (125.8 inches) of rainfall in 2020. This substantial precipitation can be attributed to Colombia's equatorial positioning, its proximity to the Intertropical Convergence Zone (where trade winds from both hemispheres converge), dual coastlines, and the presence of the Andes mountain range.

Top 10 countries with the lowest average precipitation, mm

  1. Egypt: 18
  2. Libya: 56
  3. Saudi Arabia: 59
  4. Qatar: 74
  5. UAE: 78
  6. Bahrain: 83
  7. Algeria: 89
  8. Mauritania: 92
  9. Jordan: 111
  10. Kuwait: 121
Most of the countries with arid climates are in North Africa and the Middle East.

Despite having sea coasts, countries in North Africa such as Egypt and Libya are arid. High-pressure systems block moist air, mountains create rain shadows, and cold ocean currents limit evaporation. The region falls within the 30-degree latitude band around the equator, which creates dry atmospheric conditions leading to the formation of deserts.


To learn more about the climate of our planet have a look at the following books:

This post may contain affiliate links. As an Amazon Associate, I earn from qualifying purchases.


Comments

Popular posts from this blog

Find cities with similar climate

This map has been created using The Global environmental stratification. The Global environmental stratification (GEnS), based on statistical clustering of bioclimate data (WorldClim). GEnS, consists of 125 strata, which have been aggregated into 18 global environmental zones (labeled A to R) based on the dendrogram. Interactive map >> Via www.vividmaps.com Related posts: -  Find cities with similar climate 2050 -  How global warming will impact 6000+ cities around the world?

The Appalachian Mountains, the Scottish Highlands, and the Atlas Mounts in Africa were the same mountain range

The Central Pangean Mountains was a prominent mountain ridge in the central part of the supercontinent Pangaea that extends across the continent from northeast to southwest through the Carboniferous , Permian Triassic periods. The mountains were formed due to a collision within the supercontinents Gondwana and Laurussia during the creation of Pangaea. It was comparable to the present Himalayas at its highest peak during the start of the Permian period. It isn’t easy to assume now that once upon a time that the Scottish Highlands, The Appalachian Mountains, the Ouachita Mountain Range, and the Atlas Mountains in northwestern Africa are the same mountains , once connected as the Central Pangean Mountains.

Moose population in North America

The moose population in North America is shrinking swiftly. This decrease has been correlated to the opening of roadways and landscapes into this animal's north range.   In North America, the moose range includes almost all of Canada and Alaska, the northern part of New England and New York, the upper Rocky Mountains, northern Minnesota and Wisconsin, Michigan's Upper Peninsula, and Isle Royale.    In 2014-2015, the North American moose population was measured at around one million animals. The most abundant moose population (about 700,000) lives in Canada. About 300 000 moose remains in nineteen U.S. states Alaska, Colorado, Connecticut, Idaho, Maine, Massachusetts, Minnesota, Montana, Michigan, Nevada, New Hampshire, New York, North Dakota, Oregon, Utah, Vermont, Washington, Wisconsin, and Wyoming. The largest moose specimens are found in Alaska 200 thousand moose. Below the map shows the size of US states scaled by the moose population.     Via www.vividmaps.com