Human Climate Niche Mapped

Dutch research ecologist Marten Scheffer and his coworkers at the Santa Fe Institute and Wageningen University studied the history of global temperature, human population, and land-use assessments from the mid-Holocene period, starting about 6,000 years ago to the contemporary times.


Researchers found that people, crops, and livestock had concentrated heavily in a limited range of comparatively restricted climate conditions. This range referred to in the research as the "human climate niche," has remained unchanging since 6,000 years ago.


These thousands of years of human history reveal how society flourishes when we remain within it and the instability that occurs when it is moved out of these climatic zones.


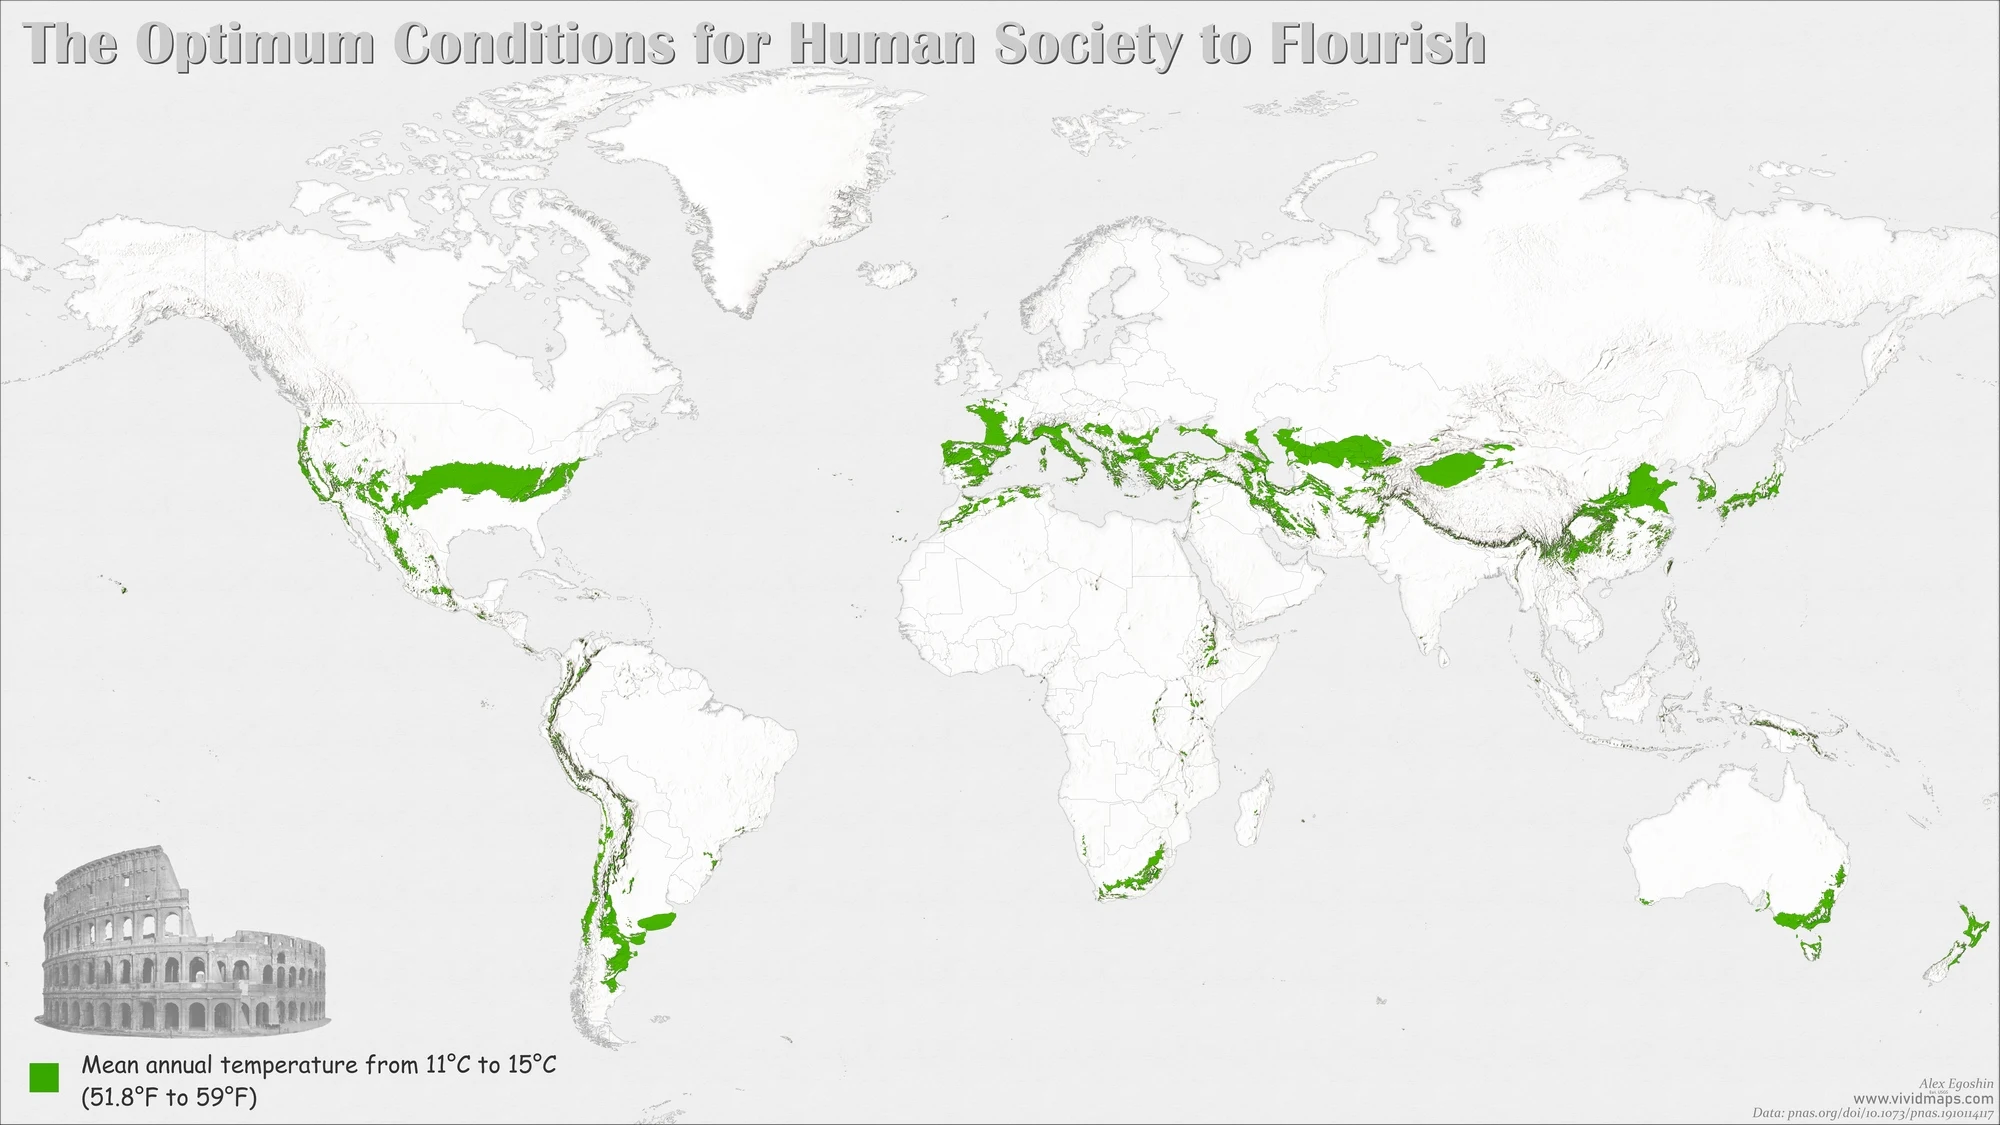
According to the analysis, the optimum conditions for human civilization to flourish have a mean annual temperature of 11 to 15° C (51.8 to 59 °F). The ideal average temperature for national economic success is 13°C (55.4°F). 

The modern production of crops and livestock is mainly restricted to the same climatic conditions. The exact optimum has been seen for nations' agricultural and nonagricultural economic output through analyses of year-to-year variation.


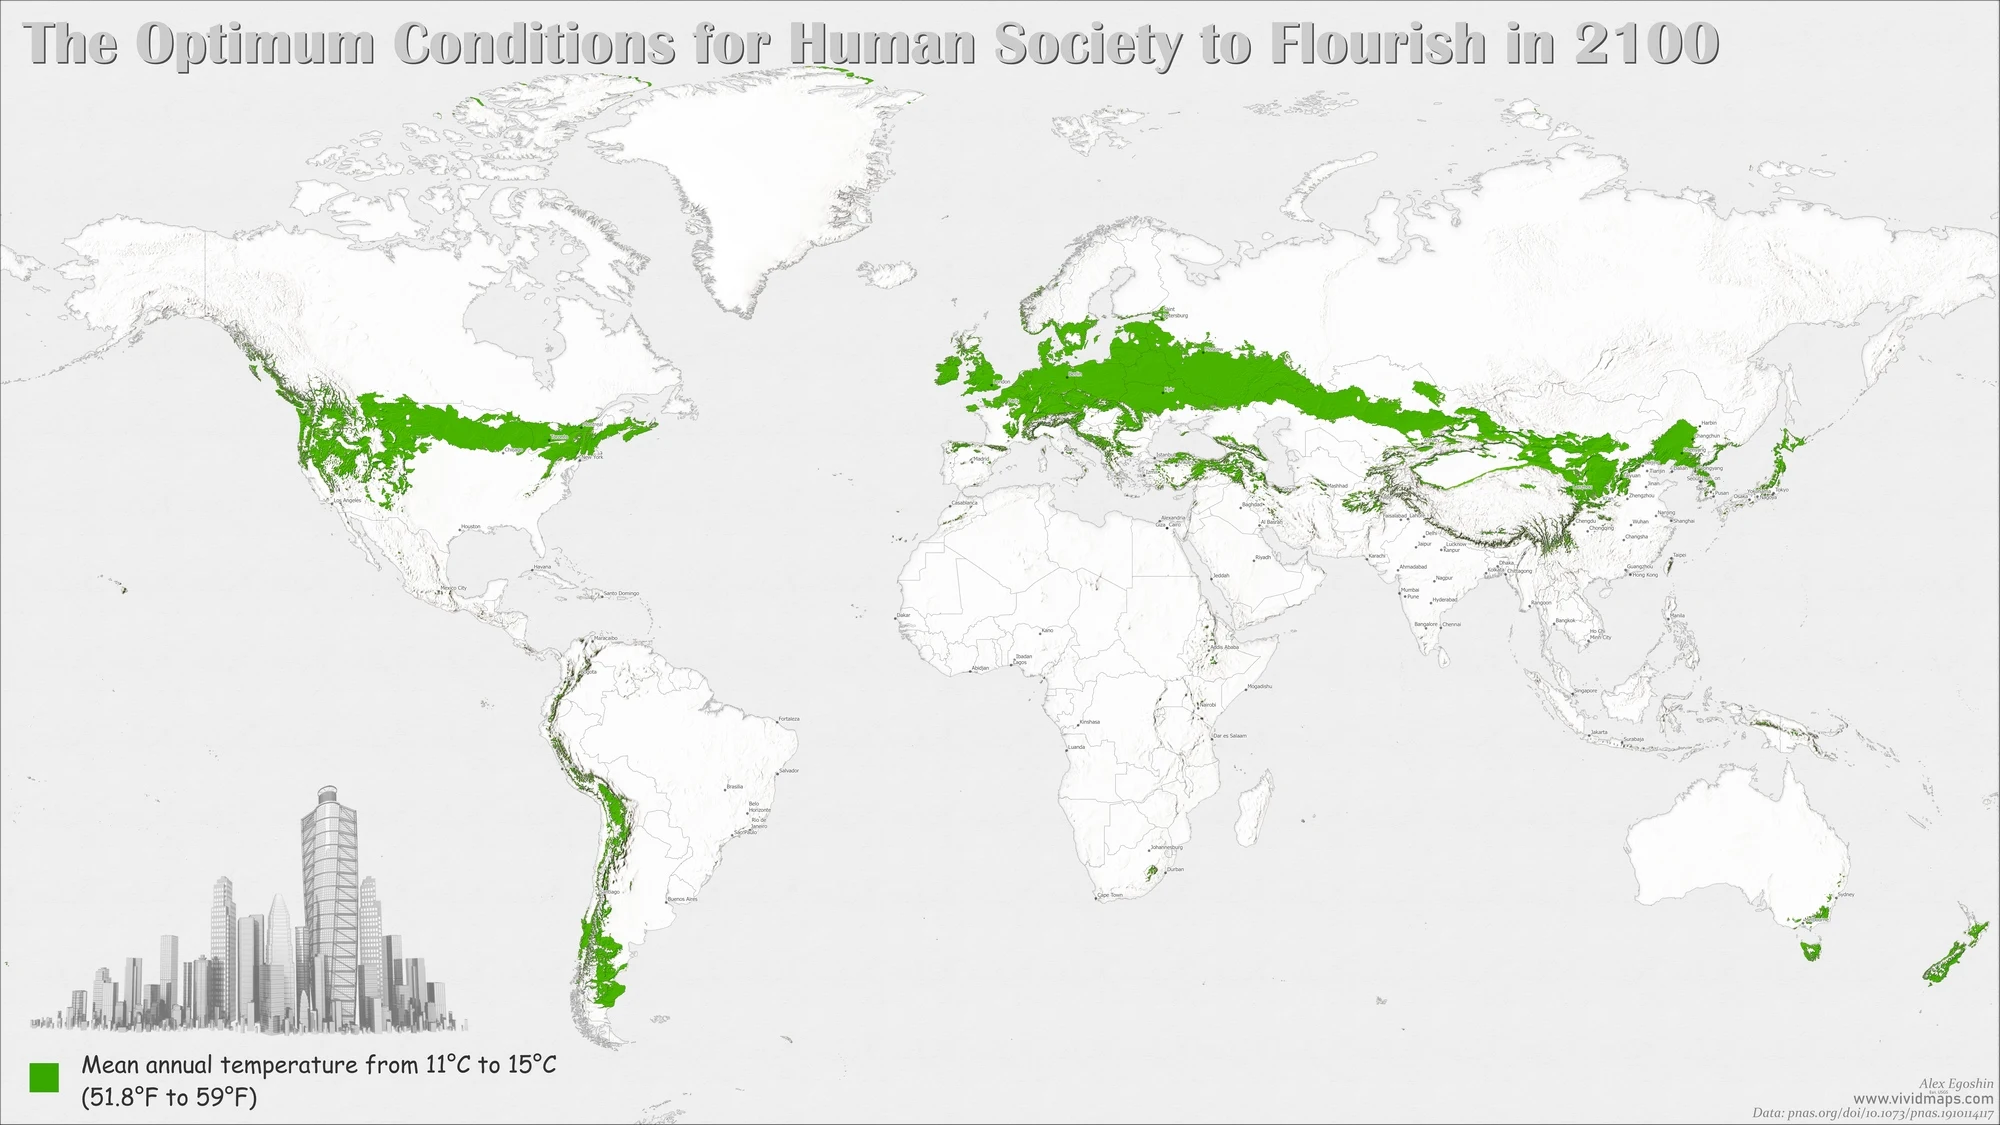
For mapping territories with mean annual temperature from 11°C to 15°C (51.8 to 59 °F), Alex Egoshin used the raster image of the bioclimatic variable of Annual Mean Temperature (BIO1). According to the map globally, the Earth’s surface area with optimal conditions for human society to flourish is about 7.7 million square kilometers or 3,0 million square miles.


The Optimum conditions for human society to flourish

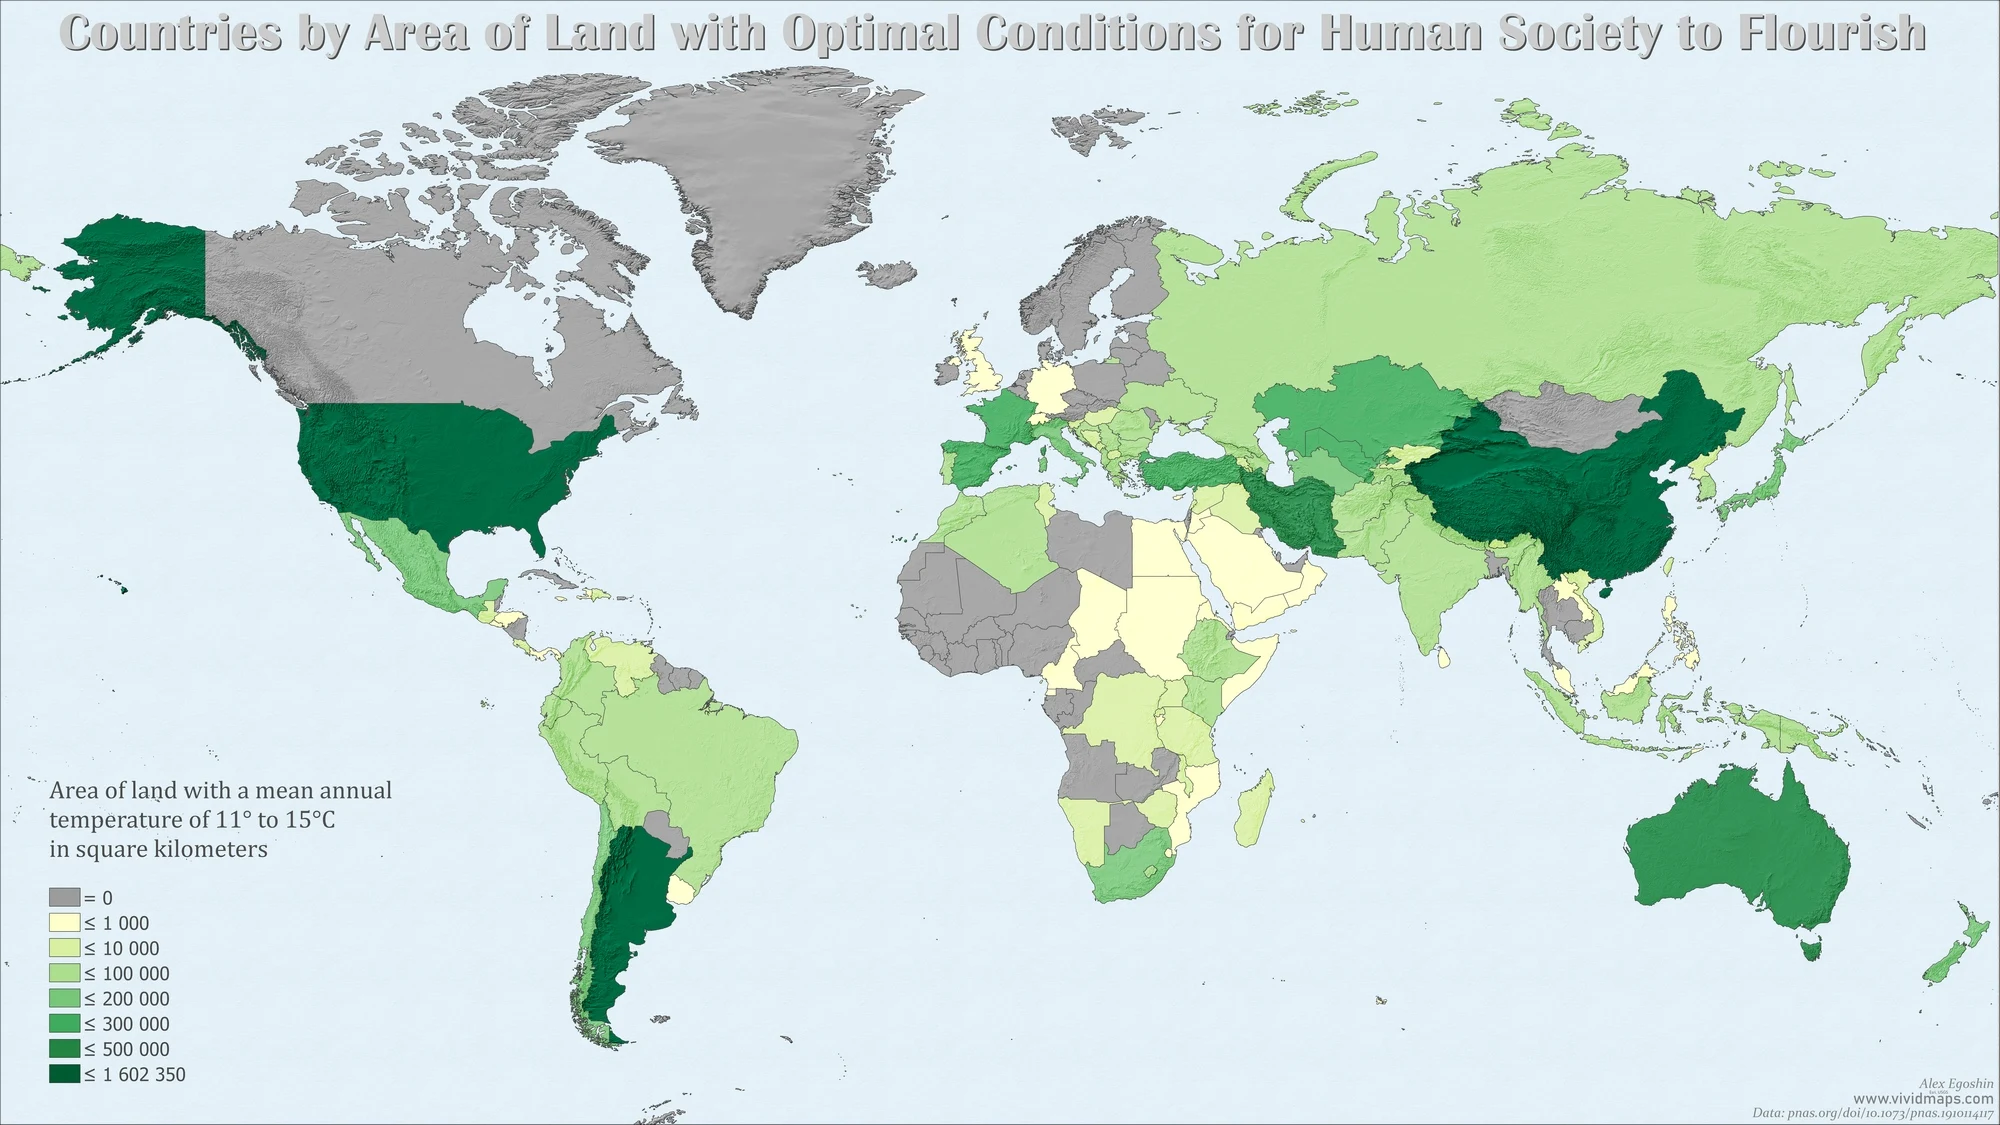
According to this map, the wealthiest country in the world, the United States, has the largest area with the optimum conditions for human society to flourish. Second place in the ranking of nations with optimal climatic conditions for thriving humanity is the world’s second economy–China.

Countries by area of land with optimal conditions for human society to flourish

Here is the map of a land area with optimal conditions for human society to flourish per capita.

Land area with optimal conditions for human society to flourish per capita


Warming will damage the economies of many nations, specifically those that are densely populated. Such nations as India, Indonesia, Brazil, and Nigeria are already much warmer, representing the consequence of climate change on their economic growth will be even more significant. Today, about 0.8% of the planet’s surface experiences mean annual temperatures above 29° Celsius (84.2°F), particularly in the Sahara region of Africa. However, with predicted rises in global average surface temperatures, this area is expected to broaden significantly to cover almost 19% of the worldwide land. According to some analysis, a result of climate change that shifts climatic zones would leave 1–3 billion people outside the climate conditions that have nurtured human society to date. This would not be a severe problem if few people lived in that part of the world, but it is one of the world’s fastest-growing areas.

According to the researchers, the human climate niche is projected to shift significantly to higher latitudes. So at present, the U.K. and Germany are cooler than 13°C, meaning their economies may enhance slightly as temperatures rise.

The maps below illustrate how the optimum conditions for human society to flourish will change by the end of the 21st century.

The Optimum conditions for human society to flourish in 2100


For creating this map, Alex Egoshin used future climate data from the Coupled Model Intercomparison Project Phase 6 (CMIP6) for the general circulation model MIROC6 and climate projection ssp585.


By 2100, Europe’s climate, except for the southern part, will be even more comfortable. The zone with the most comfortable climate in North America will be predominantly along the border between the US. and Canada.


Globally, the Earth’s surface area with optimal conditions for human society to flourish will grow by 32 percent from 7,738,067 to 11,390,271 square kilometers (from 2,987,684 to 4,397,808 sq mi).


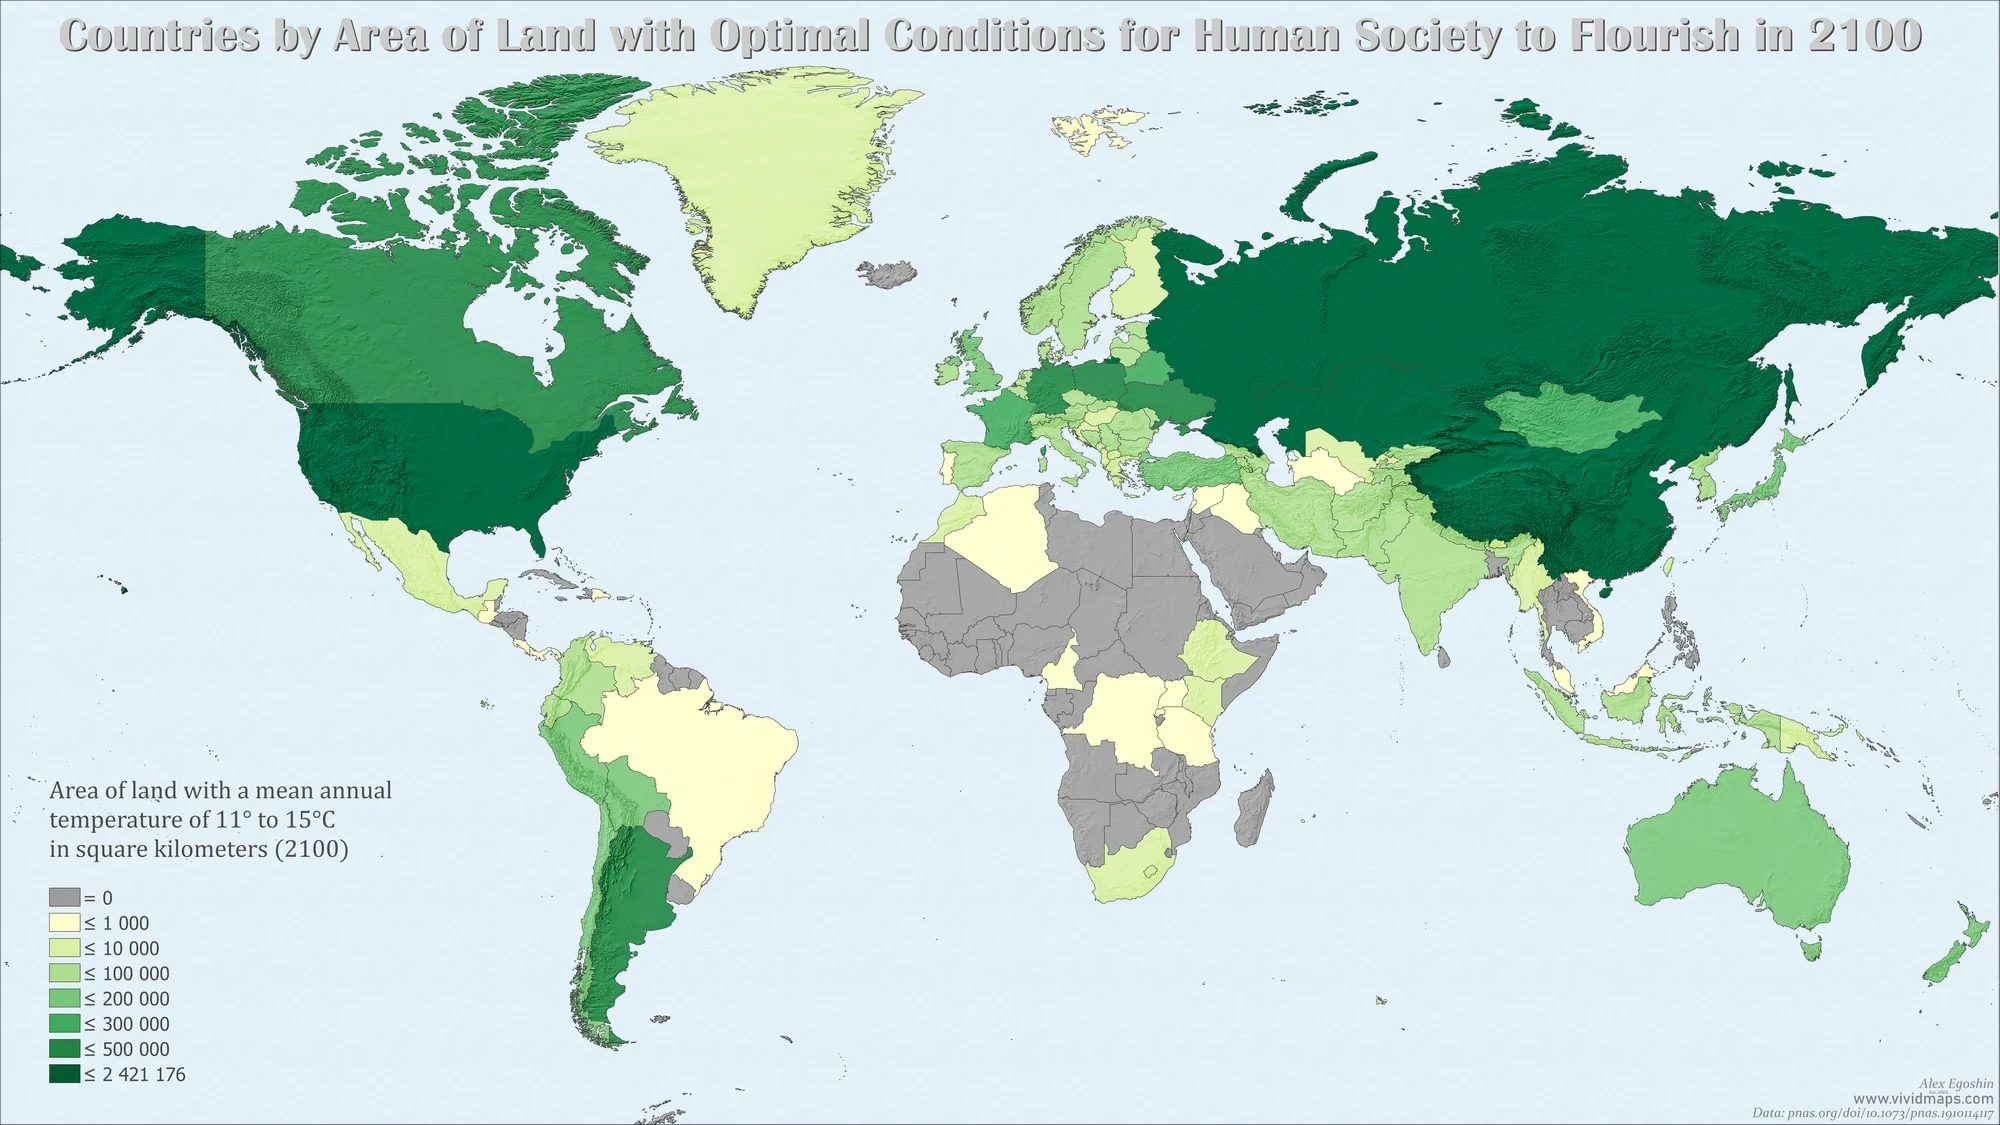
By the end of the 21st century, the U.S., China, Russia, and Kazakhstan will have the most expansive territories with a comfortable climate for life and economic development.


Countries by area of land with optimal conditions for human society to flourish in 2100

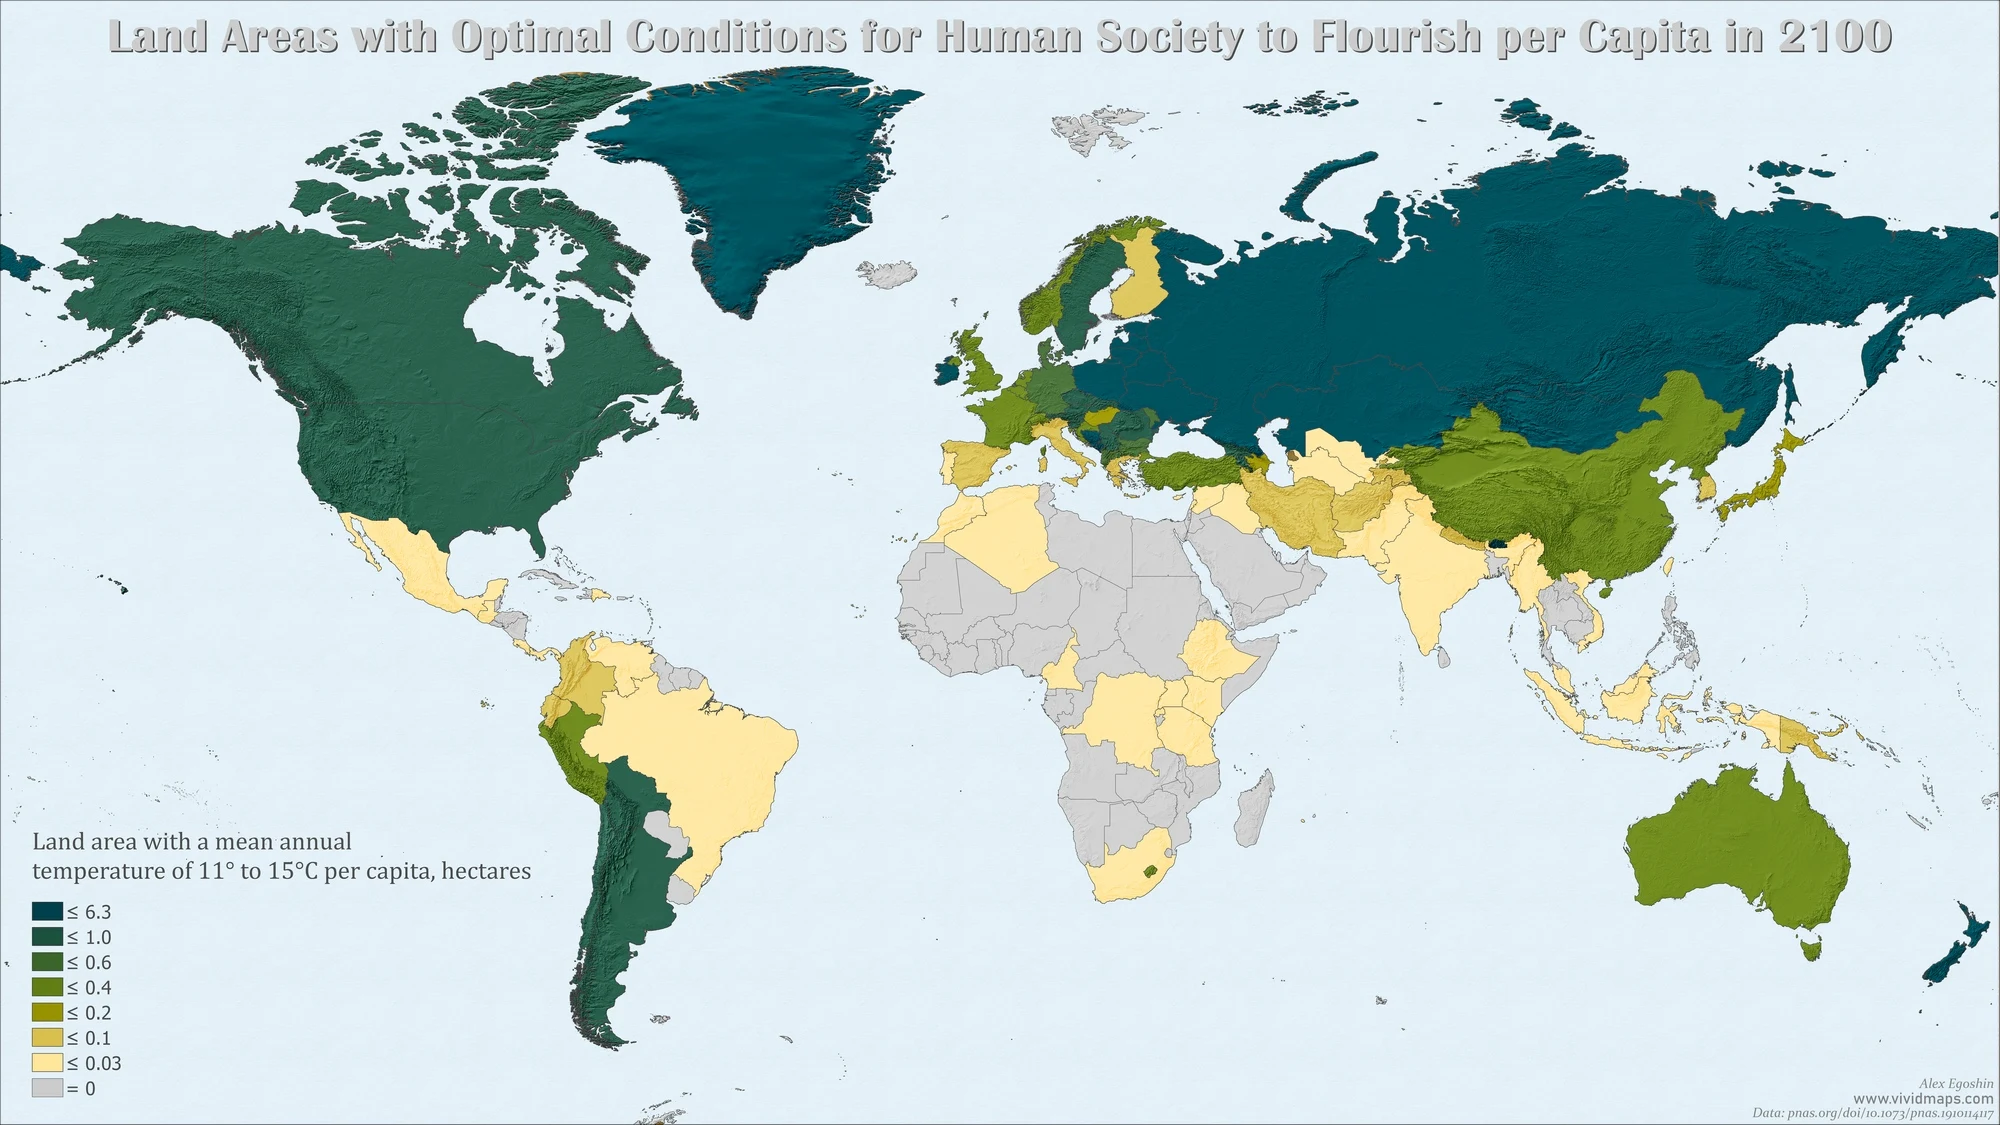
Here is the map of a land area with optimal conditions for human society to flourish per capita and the map of countries by the number of people per sq km of land area with optimal conditions for human society to thrive by the end of the 21st century created using UN data on the projected population in 2100.

land area with optimal conditions for human society to flourish per capita


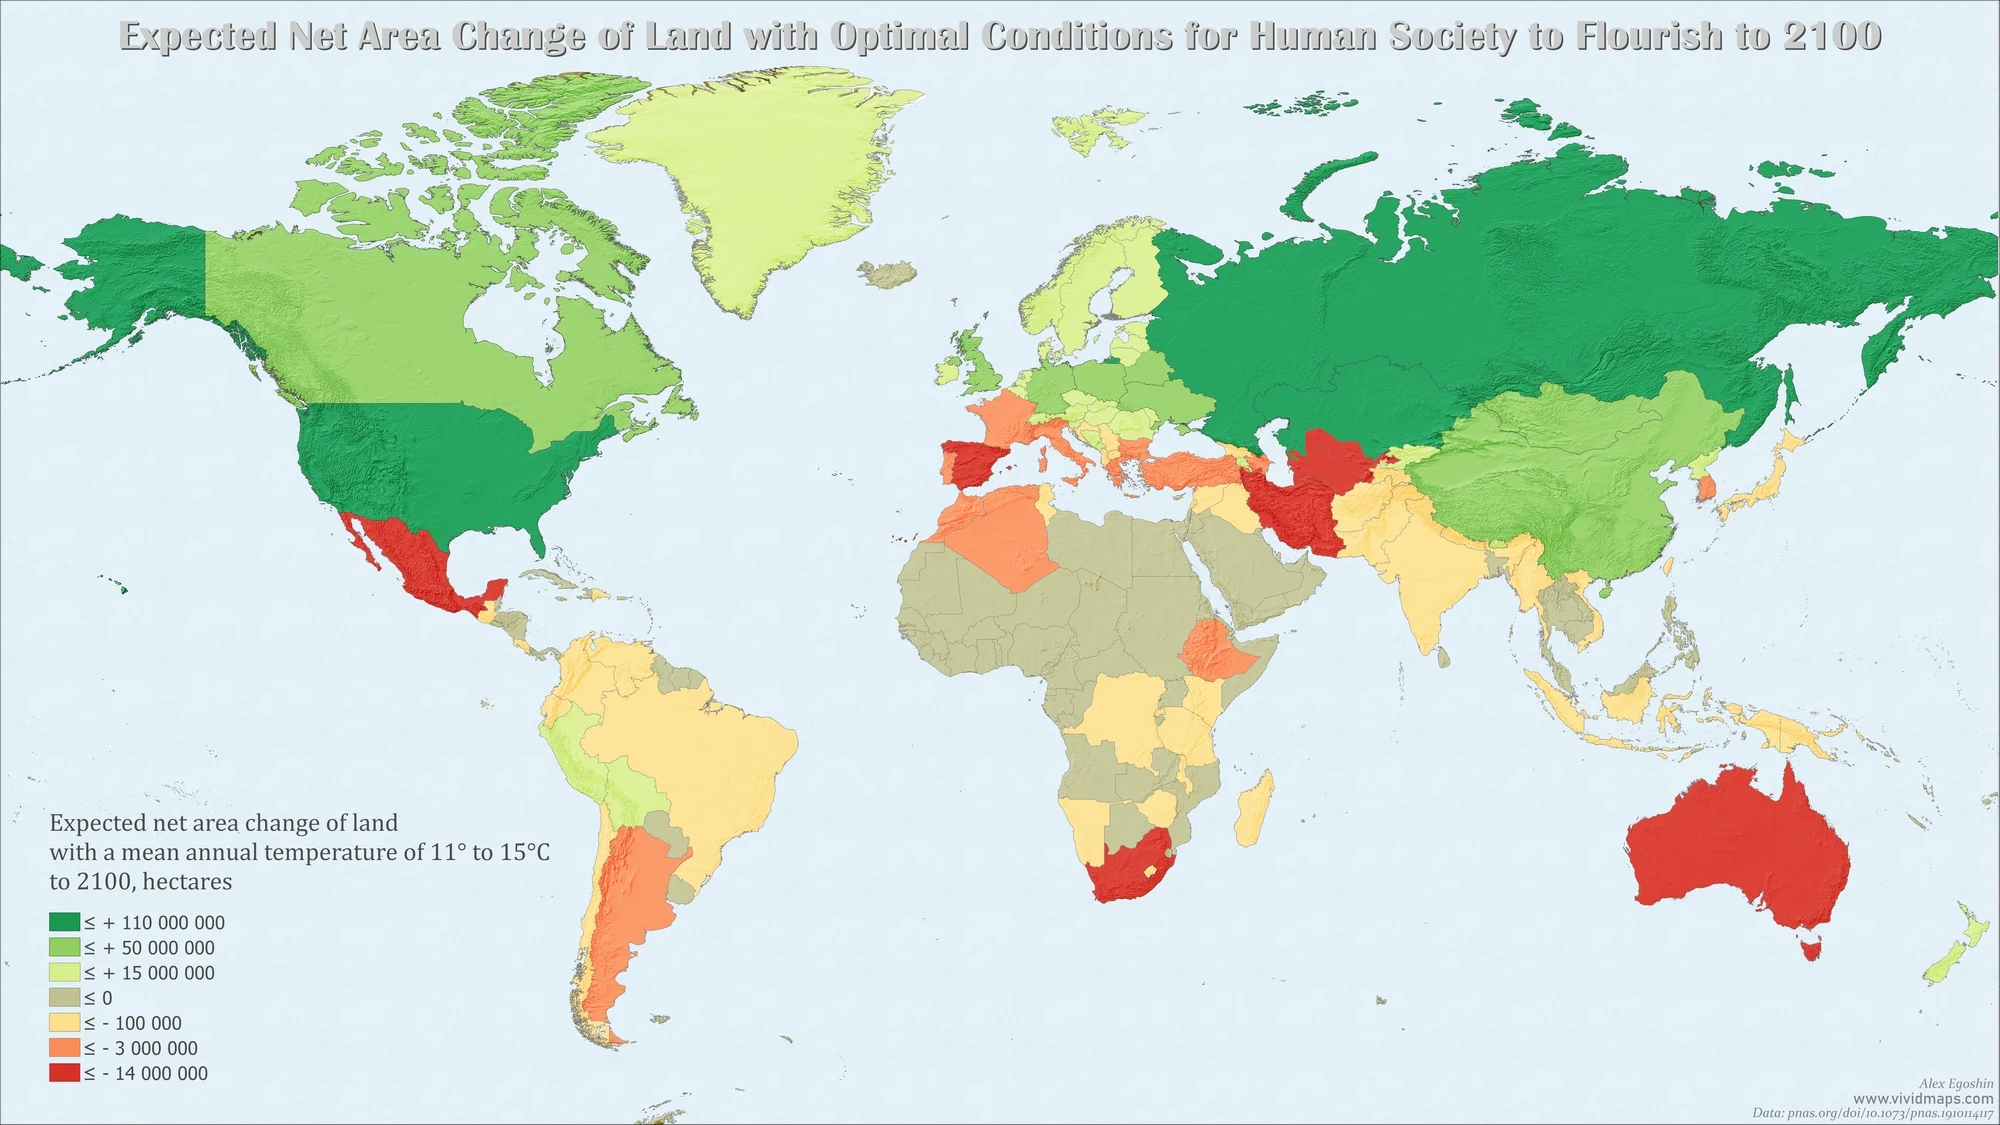
In absolute numbers, Russia, the U.S., and Kazakhstan will benefit most from climate change, while Iran, Uzbekistan, Spain, and Australia will lose the most.

Expected Net Area Change of Land with Optimal Conditions for Human Society to Flourish per capita to 2100

According to the scientists, business-as-usual climate change scenario, the geographical position of this temperature niche is predicted to shift more over the coming fifty years than it has shifted since 6000 BP. As a result, climate change’s effect will considerably increase global income inequality and reshape the global economy by decreasing average global incomes by approximately 23 percent by 2100. Populations will not simply track the changing climate; adaptation in situ may address some challenges, and many other factors affect migration decisions.
This post may contain affiliate links. As an Amazon Associate, I earn from qualifying purchases.


Comments

Popular posts from this blog

Moose population in North America

The moose ( Alces alces ) is the largest member of the deer family, characterized by its massive size, long legs, and distinctive broad, palmate antlers found in males. They have a dark brown or black coat and a humped shoulder. Moose are primarily found in the boreal and mixed deciduous forests of North America, Europe, and Asia. They are solitary animals, often found near bodies of water, and are herbivores that feed on leaves, bark, twigs, and aquatic vegetation. Despite their size, moose are strong swimmers and can run up to 35 miles per hour. The moose population in North America is shrinking swiftly. This decrease has been correlated to the opening of roadways and landscapes into this animal's north range.   In North America, the moose range includes almost all of Canada and Alaska, the northern part of New England and New York, the upper Rocky Mountains, northern Minnesota and Wisconsin, Michigan's Upper Peninsula, and Isle Royale.    In 2014-2015, the North American moo

Map of Fox Species Distribution

Foxes are small to medium-sized members of the Canidae family, which also includes wolves, dogs, and other related animals. There are about 37 species of foxes distributed around the world, and they inhabit a wide range of environments, from forests and grasslands to deserts and urban areas. Below is the map of fox species distribution  created by Reddit user isaacSW Here are some of the most well-known fox species and their distribution: Red Fox ( Vulpes vulpes ): The red fox is one of the most widely distributed fox species and is found in North America, Europe, Asia, and parts of North Africa. They are adaptable and can live in a variety of habitats, including forests, grasslands, and urban areas. Arctic Fox ( Vulpes lagopus ): The Arctic fox is found in the Arctic regions of North America, Europe, and Asia. They have adaptations that help them survive in cold climates, such as a thick coat that changes color with the seasons. Gray Fox ( Urocyon cinereoargenteus ): The gray fox

Find cities with similar climate

This map has been created using The Global environmental stratification. The Global environmental stratification (GEnS), based on statistical clustering of bioclimate data (WorldClim). GEnS, consists of 125 strata, which have been aggregated into 18 global environmental zones (labeled A to R) based on the dendrogram. Interactive map >> Via www.vividmaps.com Related posts: -  Find cities with similar climate 2050 -  How global warming will impact 6000+ cities around the world?