
Visualization of noise pollution for the entire world based on top of OSM data. Search for your city and check for the noisy places.
Check out the GitHub repository for the code and styles. You can download the vector tiles from GitHub as well.
In the model we add a buffer to noisy objects. This is the area that is probably affected by noise. Very noisy objects get a high buffer and less noisy objects a smaller buffer.
In order for this to work we make several assumptions:
1.Highways, trunks, primary and secondary roads are noisy, normal street or service roads are not.
2. Railways are noisy.
3. Retail and industrial zones always have a noise base limit.
4. All shops and food places (especially restaurants) are noisy.
5. Most party and event buildings are noisy (except some shady places).
6. Most leisure buildings are noisy.
7. Some sport buildings are noisy.
8. Some tourism buildings are noisy.
For OSM features that match these criterias we assign a buffer and remove the overlapping parts (otherwise the vector tile size would explode). This results in a simple approximation of noise pollution for cool data visualizations.
Let’s take a look at some specific cities because they are the most interesting with lots of OSM data.
Stockholm
Stockholm has a lot of noise from the railways (like Arlanda Express). The old town and vicinity around the Stockholm Central rail station contain a lot of small noisy shops. South of Humlegården park there seem to be many clubs lighting up the noise map. Industrial noise is mostly coming from Djurgårdsstaden and especially Hjorthagen.

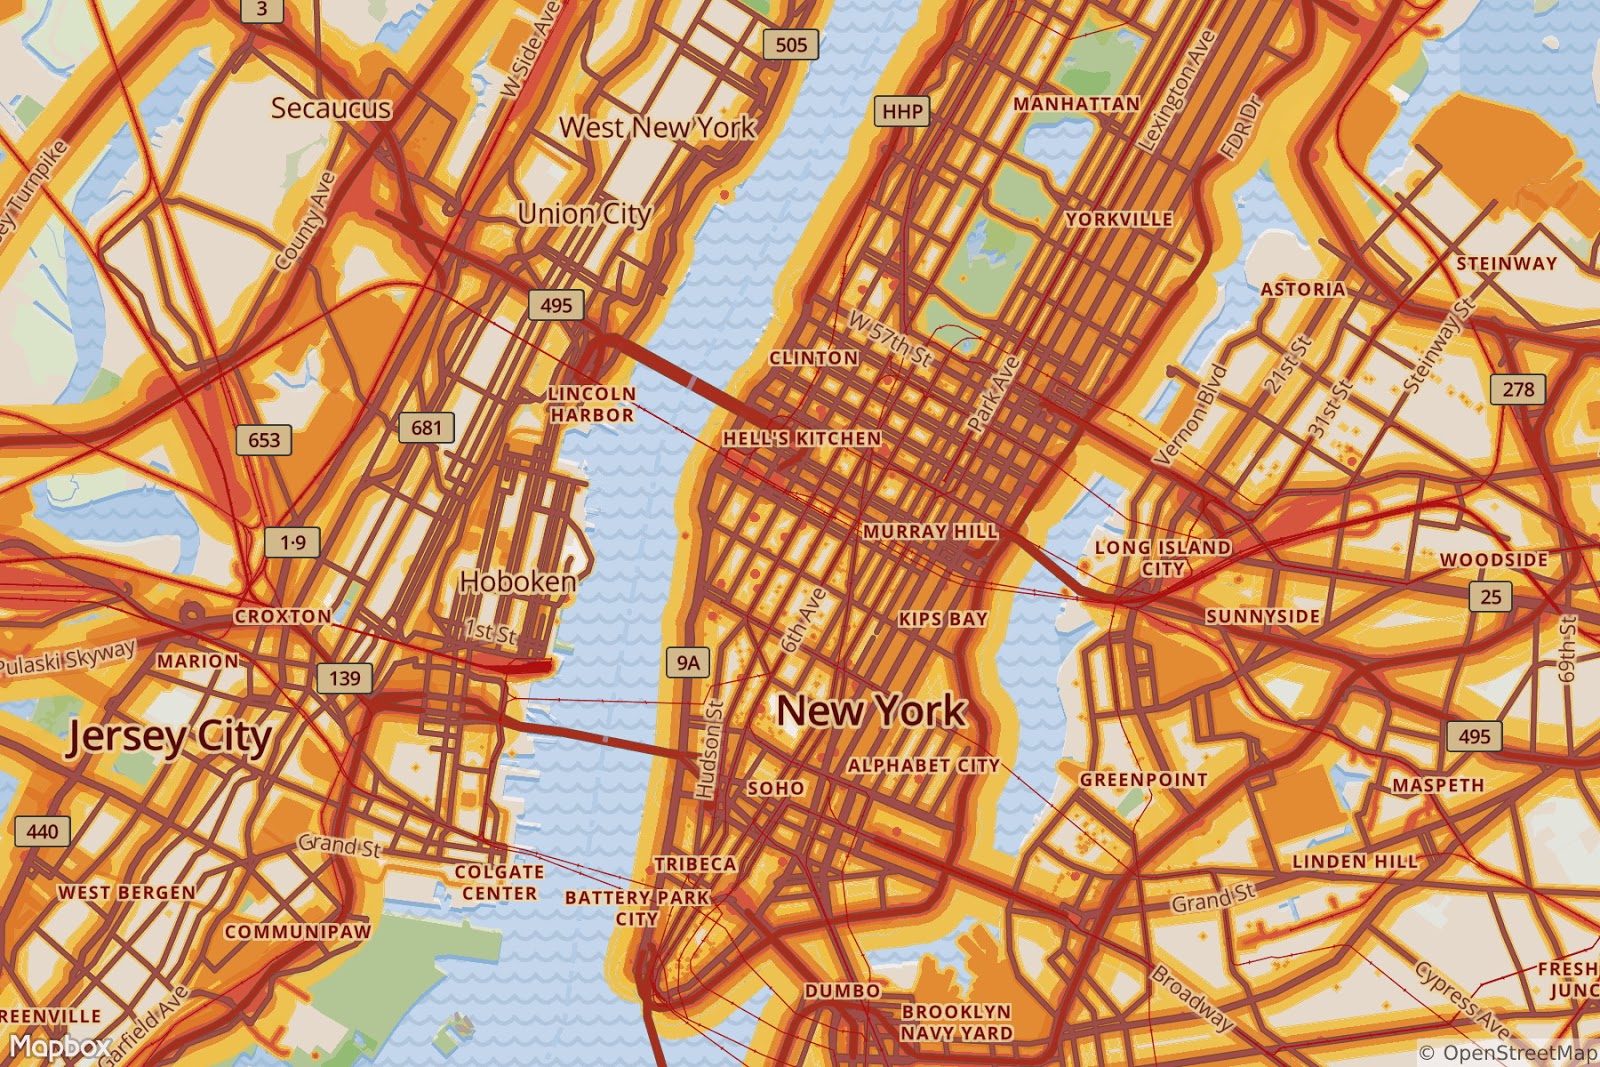
New York
The subway is not responsible for any noise because it is underground. It is really cool how Central Park seems to be a noise free zone. Most noise is coming from the big roads in the center and the shops around it. There is also a lot of industrial noise around the Brookylin Navy Yard, Steinway and Hunts Point.
Zurich
The railway stations at Hardbrücke and Hauptbahnhof are the main source of high noise in the city. You can also see the many shops that make Zurich a noisy place. The clubbing scene at Langstrasse and Limmatquai is also clearly visible.

Paris
Paris has a lot of shops in the center that emit a medium level of noise. The rails leading to the different rail stations are all hubs of noise in the city. The motorways leading around and into the city are also especially visible

The noise pollution areas are divided into three noise level.
| Zone | dB |
|---|---|
| L1 | ≥ 65 |
| L2 | 55 - 64.9 |
| L3 | 45 - 54.9 |
Roads
| Tag | L1 | L2 | L3 |
|---|---|---|---|
highway=motorway |
60m |
220m |
500m |
highway=trunk |
50m |
190m |
400m |
highway=primary |
35m |
160m |
300m |
highway=secondary |
80m |
125m |
|
highway=tertiary |
35m |
65m |
Railways
| Tag | L1 | L2 | L3 |
|---|---|---|---|
rail=[rail, narrow_gauge, preserved] |
30m |
60m |
100m |
rail=[light_rail, tram, funicular, monorail] |
30m |
60m |
Industrial & Retail Zones
| Tag | L1 | L2 | L3 |
|---|---|---|---|
landuse=industrial |
50m |
100m |
|
landuse=retail |
70m |
180m |
Shops & Food
| Tag | L1 | L2 | L3 |
|---|---|---|---|
shop=[any] |
30m |
65m |
|
amenity=[bar, bbq, cafe, biergarten, fast_food, food_court, ice_cream, pub, restaurant] |
35m |
75m |
Party
| Tag | L1 | L2 | L3 |
|---|---|---|---|
amenity=[cinema, casino, nightclub, gambling, stripclub, theatre, community_centre |
40m |
70m |
150m |
Leisure
| Tag | L1 | L2 | L3 |
|---|---|---|---|
leisure=[beach_resort, swimming_area, water_park |
35m |
55m |
75m |
tourism=[camp_site, museum, picnic_site, theme_park, zoo |
35m |
55m |
75m |
Sport
| Tag | L1 | L2 | L3 |
|---|---|---|---|
sport=[american_football,
 baseball, beachvolleyball, bmx, canadian_football, cockfighting,
cricket, dog_racing, field_hockey, horse_racing, ice_hockey,
ice_skating, obstacle_course, rc_car, rugby_league, rugby_union,
shooting, soccer, volleyball, tennis, water_ski] |
40m |
60m |
80m |
Via lukasmartinelli.ch
This post may contain affiliate links. As an Amazon Associate, I earn from qualifying purchases.
Comments
Post a Comment