
The Most Detailed Ecological Land Units Map in the World

Esri and the United States Geological Survey (USGS) are pleased to announce the development of the highest spatial resolution ecological land units (ELUs) map of the world ever produced. The Global ELUs map portrays a systematic division and classification of ecological and physiographic information about land surface features. The work was commissioned by the intergovernmental Group on Earth Observations (GEO), and published in print by the Association of American Geographers (AAG).


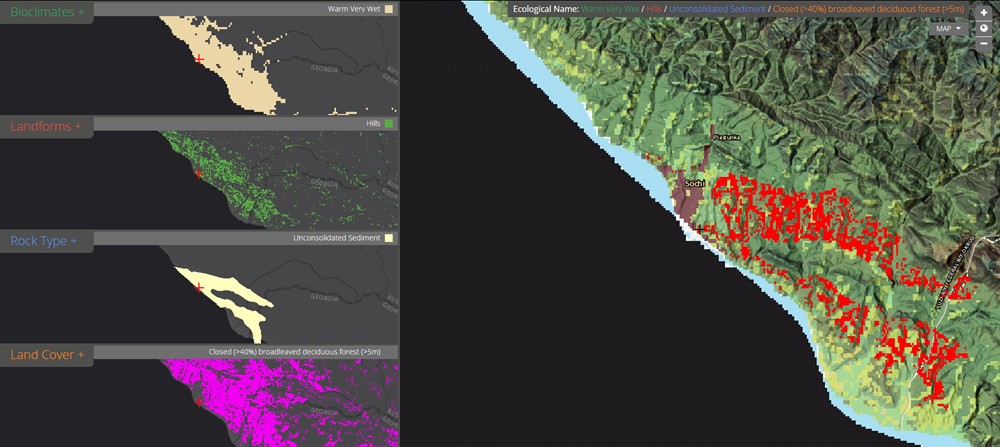
“This map provides, for the first time, a web-based, GIS-ready, global ecophysiographic data product for land managers, scientists, conservationists, planners, and the public to use for global and regional scale landscape analysis and accounting,” said Roger Sayre from the USGS. “The Global ELU map advances an objective, repeatable, ‘big data’ approach to the synthesis and classification of important earth surface data layers into distinct and ecologically meaningful land units.”
The ecological land units provide a spatial accounting framework for assessments of ecosystem services, such as carbon storage and soil formation, as well as important risks such as environmental degradation. Esri has created a Story Map and custom app that allow for additional exploration and insight.
“The ecological land units also lend themselves to the study of ecological diversity, rarity and evolutionary isolation,” said Randy Vaughan from Esri. “For example we can identify the most diverse landscapes in terms of unique ecological land features. Understanding diversity can point the way to improved conservation planning.”
The data will also be important to the study of environmental change,” added Sayre. “The objective and automated approach to the classification means that the mapping can be updated as better or more current input layers are created. The creation of change layers can also be automated.”
Learn more about the Global ELUs map at esriurl.com/globalelu.
You can browse the Story Map at esriurl.com/elu. See the custom app at esriurl.com/EcoTapestry.

This post may contain affiliate links. As an Amazon Associate, I earn from qualifying purchases.


Comments

Popular posts from this blog

Find cities with similar climate

This map has been created using The Global environmental stratification. The Global environmental stratification (GEnS), based on statistical clustering of bioclimate data (WorldClim). GEnS, consists of 125 strata, which have been aggregated into 18 global environmental zones (labeled A to R) based on the dendrogram. Interactive map >> Via www.vividmaps.com Related posts: -  Find cities with similar climate 2050 -  How global warming will impact 6000+ cities around the world?

The Appalachian Mountains, the Scottish Highlands, and the Atlas Mounts in Africa were the same mountain range

The Central Pangean Mountains was a prominent mountain ridge in the central part of the supercontinent Pangaea that extends across the continent from northeast to southwest through the Carboniferous , Permian Triassic periods. The mountains were formed due to a collision within the supercontinents Gondwana and Laurussia during the creation of Pangaea. It was comparable to the present Himalayas at its highest peak during the start of the Permian period. It isn’t easy to assume now that once upon a time that the Scottish Highlands, The Appalachian Mountains, the Ouachita Mountain Range, and the Atlas Mountains in northwestern Africa are the same mountains , once connected as the Central Pangean Mountains.

Moose population in North America

The moose population in North America is shrinking swiftly. This decrease has been correlated to the opening of roadways and landscapes into this animal's north range.   In North America, the moose range includes almost all of Canada and Alaska, the northern part of New England and New York, the upper Rocky Mountains, northern Minnesota and Wisconsin, Michigan's Upper Peninsula, and Isle Royale.    In 2014-2015, the North American moose population was measured at around one million animals. The most abundant moose population (about 700,000) lives in Canada. About 300 000 moose remains in nineteen U.S. states Alaska, Colorado, Connecticut, Idaho, Maine, Massachusetts, Minnesota, Montana, Michigan, Nevada, New Hampshire, New York, North Dakota, Oregon, Utah, Vermont, Washington, Wisconsin, and Wyoming. The largest moose specimens are found in Alaska 200 thousand moose. Below the map shows the size of US states scaled by the moose population.     Via www.vividmaps.com